• Photonics Research
  • Vol. 11, Issue 7, 1227 (2023)
Wangqi Mao1、2, Xinyu Gao3, Bo Li1、2, Yaqiang Zhang3, Pei Wang1, Hongxing Dong2、3、4、*, and Long Zhang1、2、3、5、*
Author Affiliations
  • 1Department of Optics and Optical Engineering, University of Science and Technology of China, Hefei 230026, China
  • 2Key Laboratory of Materials for High-Power Laser, Shanghai Institute of Optics and Fine Mechanics, Chinese Academy of Sciences, Shanghai 201800, China
  • 3Hangzhou Institute for Advanced Study, Chinese Academy of Sciences, Hangzhou 310024, China
  • 4e-mail: hongxingd@siom.ac.cn
  • 5e-mail: lzhang@siom.ac.cn
  • show less
    DOI: 10.1364/PRJ.489700 Cite this Article Set citation alerts
    Wangqi Mao, Xinyu Gao, Bo Li, Yaqiang Zhang, Pei Wang, Hongxing Dong, Long Zhang. Randomized whispering-gallery-mode microdisk laser arrays via cavity deformations for anti-counterfeiting labels[J]. Photonics Research, 2023, 11(7): 1227 Copy Citation Text show less
    Schematic design principle of an optical PUF label based on a deformed microdisk laser array. (a) Schematic representation of an optical PUF label (5×5 pixels in this example) based on a deformed microdisk laser array where the randomness was introduced by vapor-induced microcavity deformation. Readout of the PUF label using a confocal PL system by PL mapping and the corresponding digitization of (b) quaternary encoding and (c) binary encoding of the numbers of the lasing peak at each pixel.
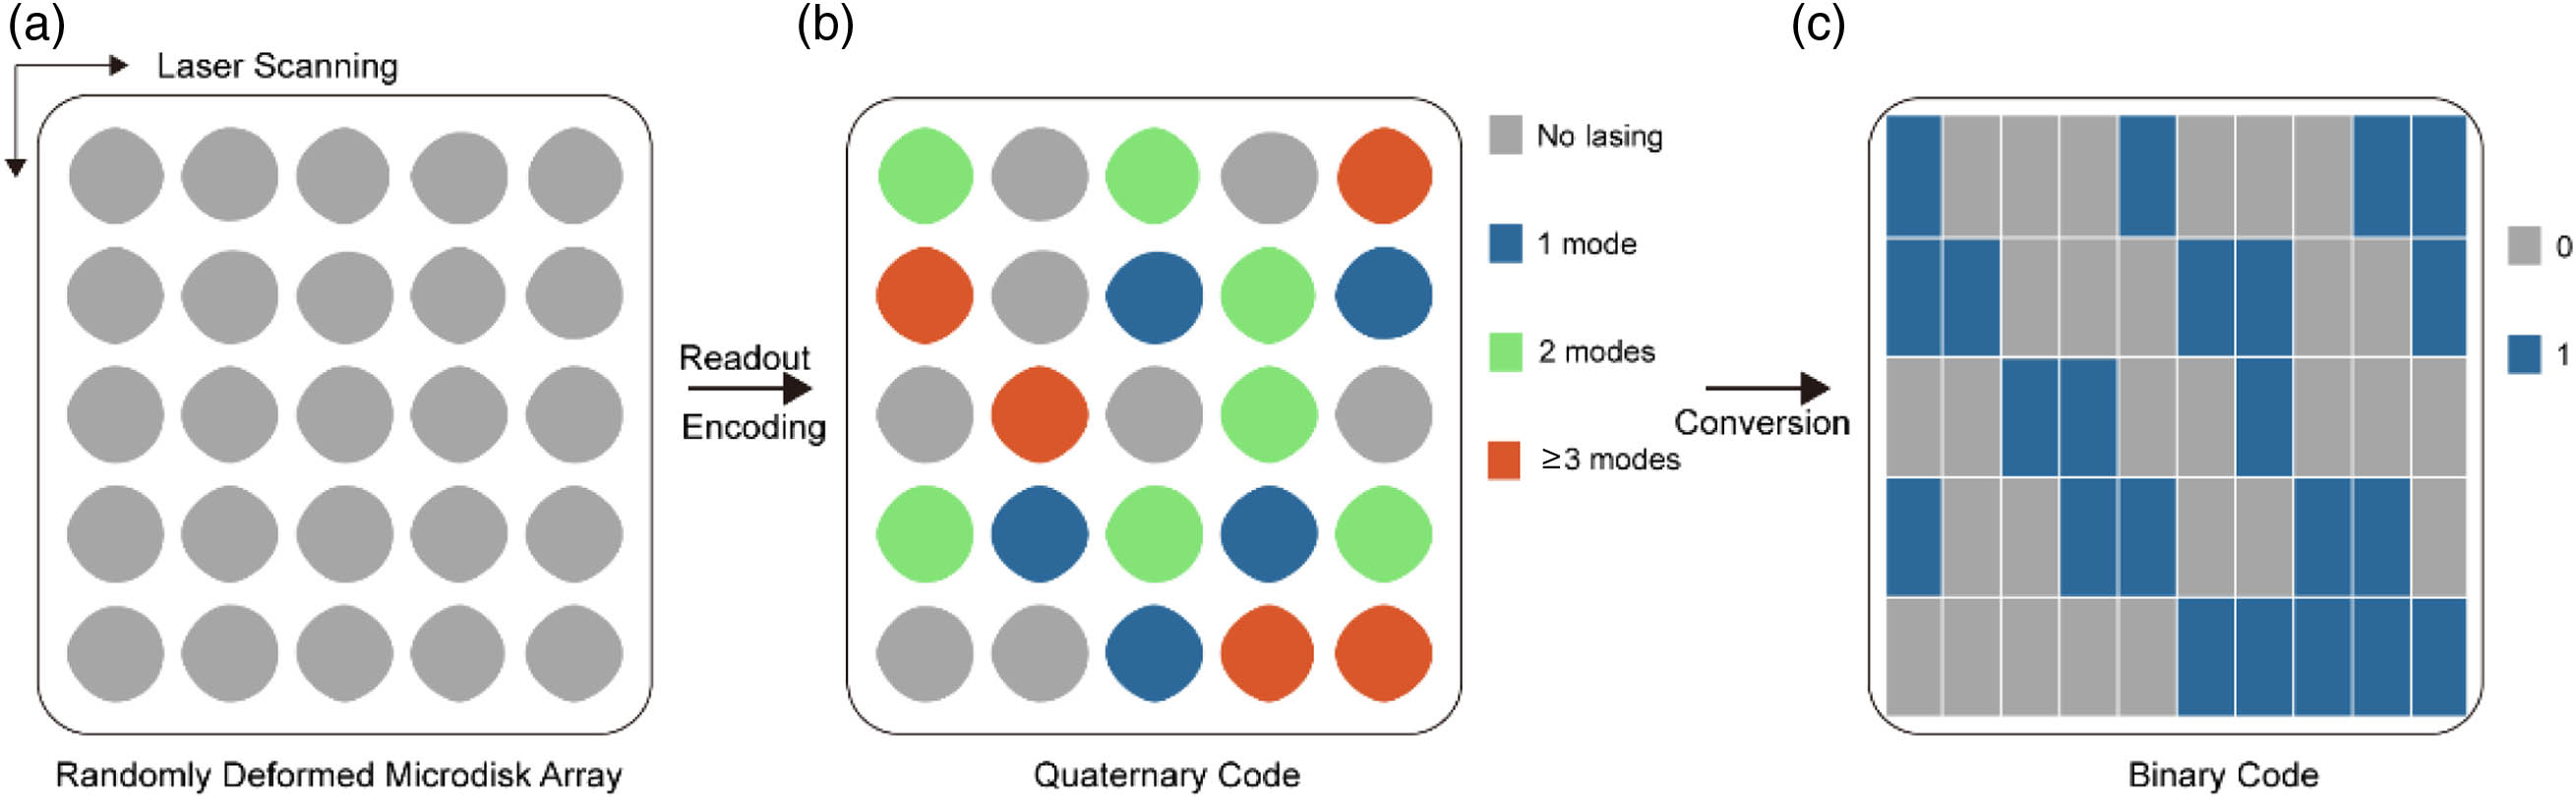
    Fig. 1. Schematic design principle of an optical PUF label based on a deformed microdisk laser array. (a) Schematic representation of an optical PUF label (5×5 pixels in this example) based on a deformed microdisk laser array where the randomness was introduced by vapor-induced microcavity deformation. Readout of the PUF label using a confocal PL system by PL mapping and the corresponding digitization of (b) quaternary encoding and (c) binary encoding of the numbers of the lasing peak at each pixel.
    Characterizations and lasing action of the perovskite microdisk array fabricated using a fs laser. (a) Schematic representation of the fabrication processes for a circular microdisk array. (b) SEM image of perovskite microdisks with a diameter of 7 μm. (c) Optical image of the obtained perovskite circular microdisks. Right inset: PL images of perovskite circular microdisks. (d) Excitation power-dependent PL spectra from an individual perovskite microdisk laser. Top inset: schematic of an individual perovskite microdisk laser pumped by a 400 nm laser excitation (∼40 fs, 10 kHz). (e) Dependence of the PL peak intensity and FWHM on the pump density, indicating the evolution from random spontaneous emission to stimulated emission and the lasing threshold at ∼4.9 μJ/cm2. (f) Lorentzian fitting of a lasing mode. The FWHM of the lasing peak δλ is 0.13 nm, corresponding to a Q factor of ∼4150.
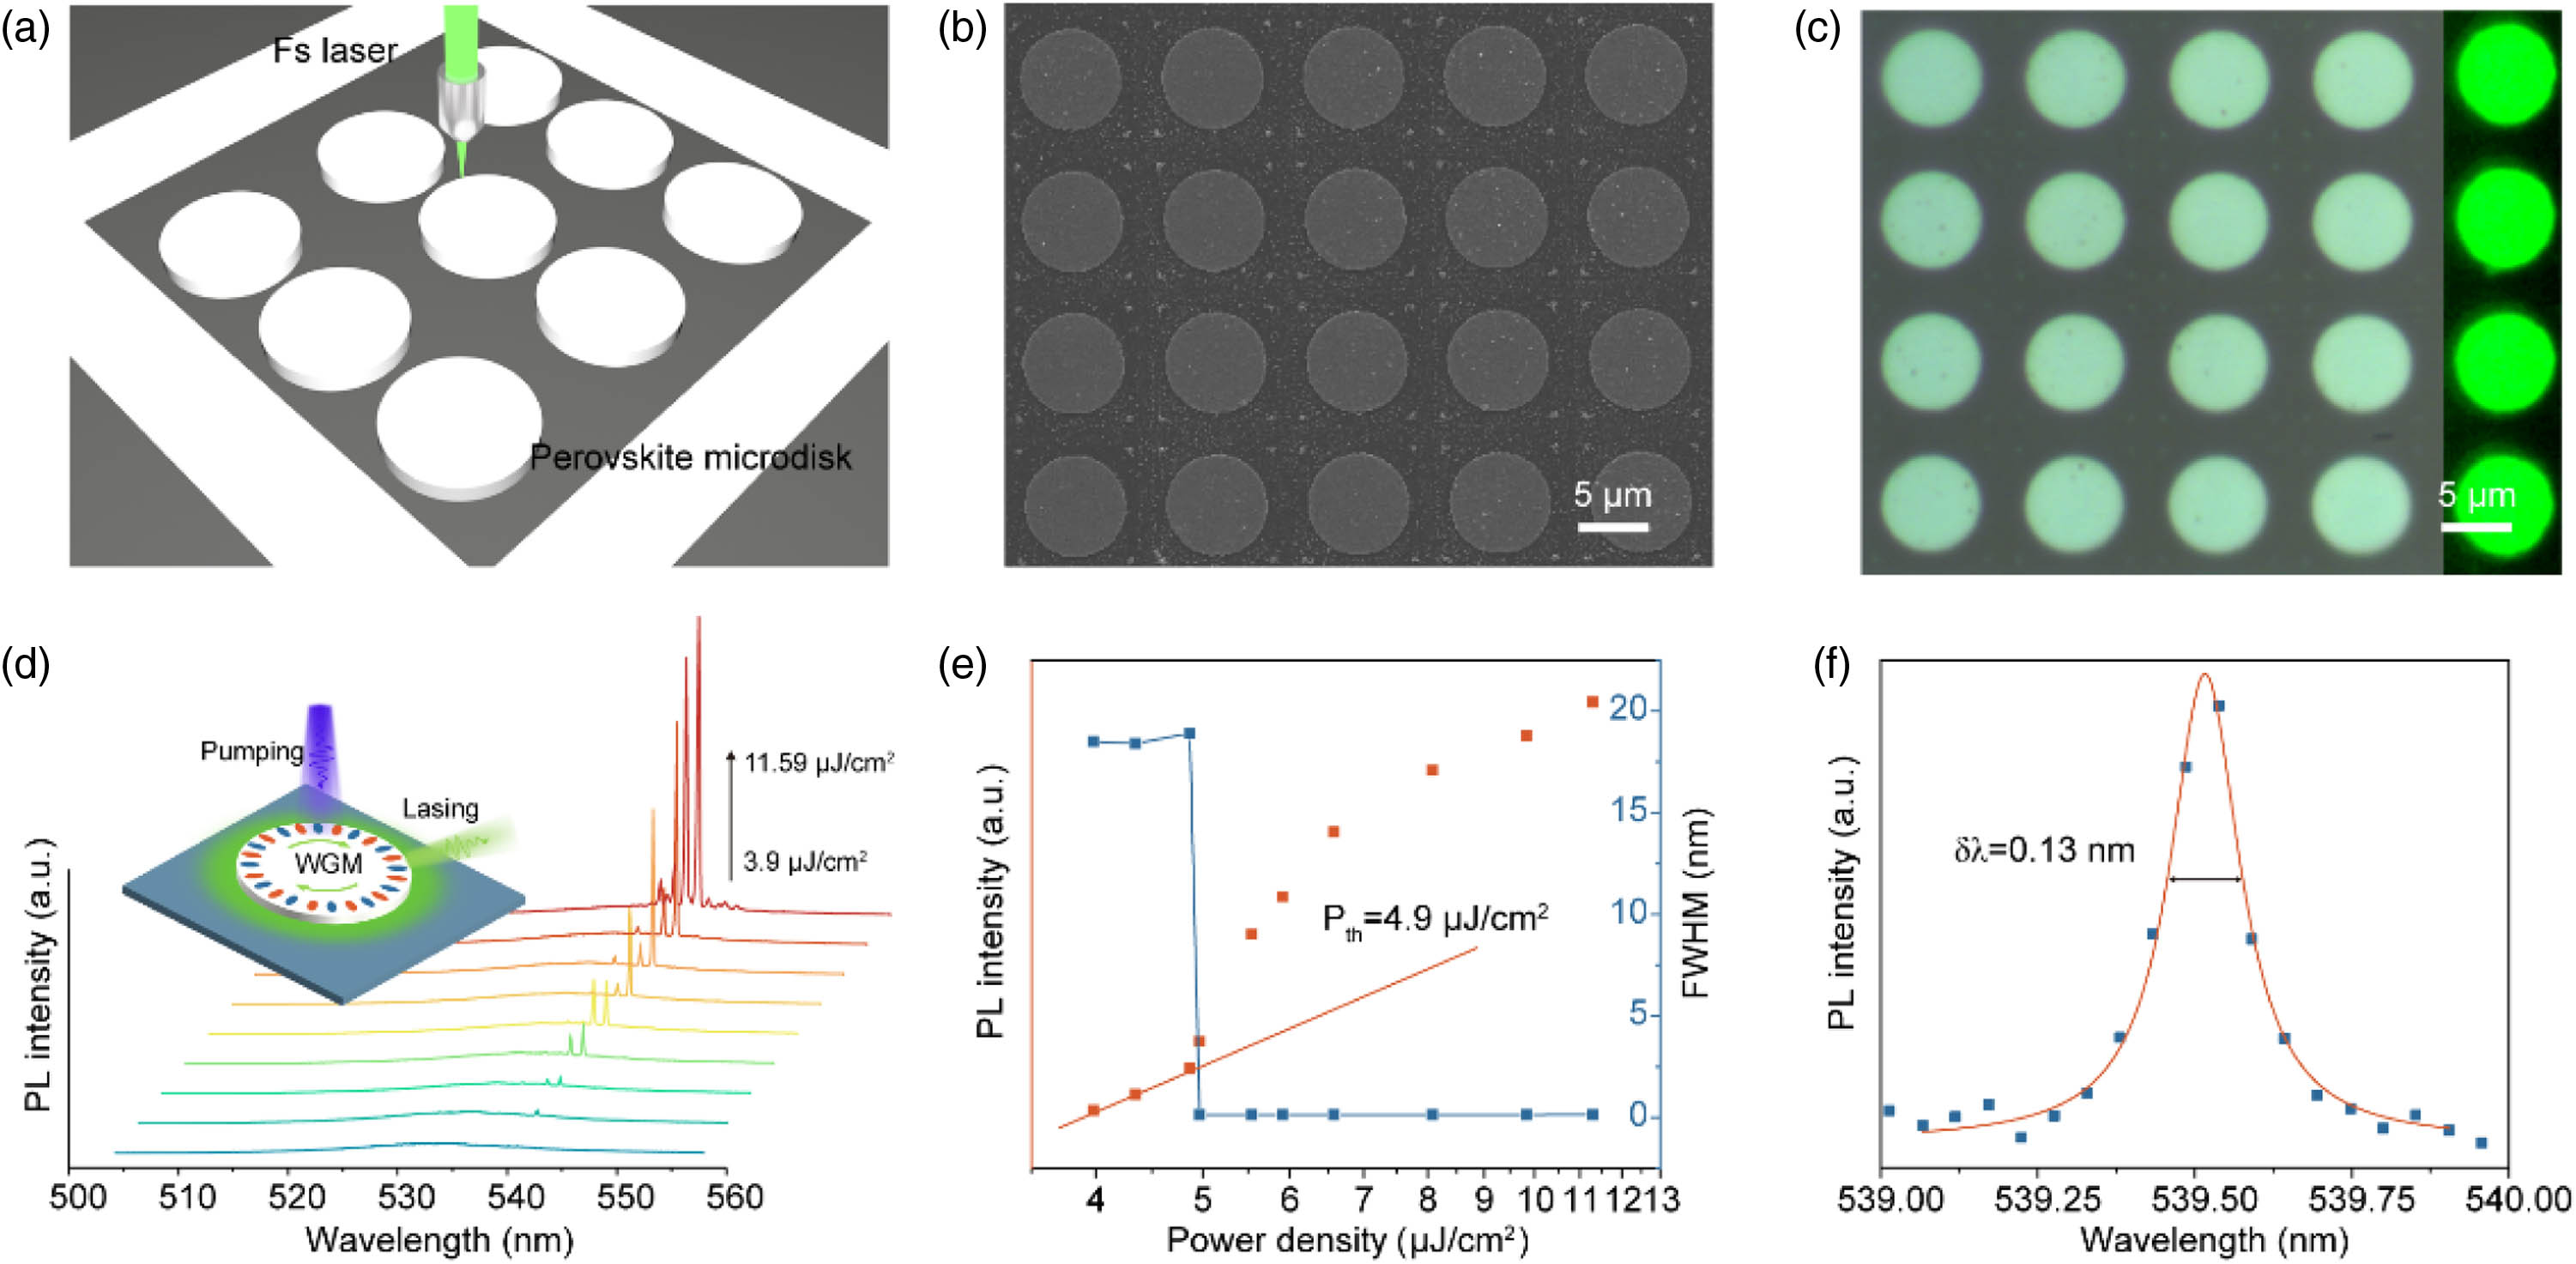
    Fig. 2. Characterizations and lasing action of the perovskite microdisk array fabricated using a fs laser. (a) Schematic representation of the fabrication processes for a circular microdisk array. (b) SEM image of perovskite microdisks with a diameter of 7 μm. (c) Optical image of the obtained perovskite circular microdisks. Right inset: PL images of perovskite circular microdisks. (d) Excitation power-dependent PL spectra from an individual perovskite microdisk laser. Top inset: schematic of an individual perovskite microdisk laser pumped by a 400 nm laser excitation (40  fs, 10 kHz). (e) Dependence of the PL peak intensity and FWHM on the pump density, indicating the evolution from random spontaneous emission to stimulated emission and the lasing threshold at 4.9  μJ/cm2. (f) Lorentzian fitting of a lasing mode. The FWHM of the lasing peak δλ is 0.13 nm, corresponding to a Q factor of 4150.
    Morphology and optical properties of deformed perovskite microdisk arrays. (a) Schematic representation of the post-treatment processes: (i) FS laser process; (ii) DMF vapor fumigation; and (iii) annealing. (b) SEM and optical images of the deformed perovskite microdisk array, indicating strong green fluorescence and deformed boundaries. (c) Normalized PL spectra of the as-prepared perovskite microdisk with and without vapor fumigation. The PL peak of the perovskite with the vapor fumigation is narrowed (FWHM, Δλ=4 nm) and blue-shifted. (d) Time-resolved photoluminescence (TR-PL) within the PL lifetime is fitted by a biexponential decay, and the microdisk with post-treatment presents a longer average lifetime (7.43 ns) than the unannealed perovskite (1.47 ns) and unfumigated perovskite microdisks (4.22 ns).
    Fig. 3. Morphology and optical properties of deformed perovskite microdisk arrays. (a) Schematic representation of the post-treatment processes: (i) FS laser process; (ii) DMF vapor fumigation; and (iii) annealing. (b) SEM and optical images of the deformed perovskite microdisk array, indicating strong green fluorescence and deformed boundaries. (c) Normalized PL spectra of the as-prepared perovskite microdisk with and without vapor fumigation. The PL peak of the perovskite with the vapor fumigation is narrowed (FWHM, Δλ=4  nm) and blue-shifted. (d) Time-resolved photoluminescence (TR-PL) within the PL lifetime is fitted by a biexponential decay, and the microdisk with post-treatment presents a longer average lifetime (7.43 ns) than the unannealed perovskite (1.47 ns) and unfumigated perovskite microdisks (4.22 ns).
    Cavity mode analysis and lasing action of deformed microdisks. (a) Simulated field distribution of a deformed microdisk cavity indicates effective light confinement along the edges and a WGM-like resonant loop. (b) Quality factor (Q factor) of a microdisk cavity indicating the increase in deformation; as the degree of deformation increases, the Q factor becomes progressively lower. (c) Simulated Q factors of a microdisk cavity with and without deformation, indicating the decreasing number of high-Q modes after deformation. (d)–(f) Pseudocolor plot of the pump-density-dependent PL spectra of the deformed perovskite microdisks with different deformations. Insets are the corresponding PL spectra.
    Fig. 4. Cavity mode analysis and lasing action of deformed microdisks. (a) Simulated field distribution of a deformed microdisk cavity indicates effective light confinement along the edges and a WGM-like resonant loop. (b) Quality factor (Q factor) of a microdisk cavity indicating the increase in deformation; as the degree of deformation increases, the Q factor becomes progressively lower. (c) Simulated Q factors of a microdisk cavity with and without deformation, indicating the decreasing number of high-Q modes after deformation. (d)–(f) Pseudocolor plot of the pump-density-dependent PL spectra of the deformed perovskite microdisks with different deformations. Insets are the corresponding PL spectra.
    Digitization of the optical PUF-based anti-counterfeiting label. (a) Obtained optical PUF label after post-treatment; 5×5 pixels are selected as a proof of concept. (b) Digitization of the optical PUF under single-power excitation: (i) lasing spectrum of an individual microdisk laser under high-power excitation, representing four lasing peaks; (ii) quaternary encoding; and (iii) binary encoding of lasing peak numbers at each pixel with a resolution of 5×5 pixels. (c) Digitization of the optical PUF under variable-power excitation: (i) lasing spectrum of an individual microdisk laser under three power pump densities, the number of lasing peaks increases from one to four; (ii) quaternary encoding and (iii) binary encoding of lasing peak number under three power pump densities at each pixel with a resolution of 5×5 pixels; and (iv) combining the threefold binary key into a new PUF label (5×30 pixels). (d) Theoretical encoding capacity of an optical PUF label with three encoding methods dependent on the number of pixels B, possible responses A, and power variations n.
    Fig. 5. Digitization of the optical PUF-based anti-counterfeiting label. (a) Obtained optical PUF label after post-treatment; 5×5 pixels are selected as a proof of concept. (b) Digitization of the optical PUF under single-power excitation: (i) lasing spectrum of an individual microdisk laser under high-power excitation, representing four lasing peaks; (ii) quaternary encoding; and (iii) binary encoding of lasing peak numbers at each pixel with a resolution of 5×5  pixels. (c) Digitization of the optical PUF under variable-power excitation: (i) lasing spectrum of an individual microdisk laser under three power pump densities, the number of lasing peaks increases from one to four; (ii) quaternary encoding and (iii) binary encoding of lasing peak number under three power pump densities at each pixel with a resolution of 5×5  pixels; and (iv) combining the threefold binary key into a new PUF label (5×30  pixels). (d) Theoretical encoding capacity of an optical PUF label with three encoding methods dependent on the number of pixels B, possible responses A, and power variations n.
    Schematic illustration of growth process of CsPbBr3 thin film.
    Fig. 6. Schematic illustration of growth process of CsPbBr3 thin film.
    Repeatability analysis of the perovskite microdisk array fabricated by FS laser. (a) Optical image of the obtained perovskite circular microdisks with a diameter of 3 μm. (b) Laser spectra of seven equal-size perovskite microdisks. (c) Excitation threshold of seven equal-size perovskite microdisks.
    Fig. 7. Repeatability analysis of the perovskite microdisk array fabricated by FS laser. (a) Optical image of the obtained perovskite circular microdisks with a diameter of 3 μm. (b) Laser spectra of seven equal-size perovskite microdisks. (c) Excitation threshold of seven equal-size perovskite microdisks.
    Investigation of lasing origins from the thin-film-based perovskite microdisk. (a) AFM image of single-crystal CsPbBr3 thin film; a typical thickness of 150 nm is determined from the inset profile. (b) 3D-simulated field distribution of the microdisk cavity with a diameter ∼7 μm and a height ∼150 nm.
    Fig. 8. Investigation of lasing origins from the thin-film-based perovskite microdisk. (a) AFM image of single-crystal CsPbBr3 thin film; a typical thickness of 150 nm is determined from the inset profile. (b) 3D-simulated field distribution of the microdisk cavity with a diameter 7  μm and a height 150  nm.
    Simulation of the resonant mode change as a function of the microdisk deformation. (a) Simulated resonant mode of microdisk cavities with increasing deformation, indicating that the corresponding resonant wavelength exhibits a blue shift from 544.12 to 540.71 nm. (b) Simulated field distribution of the fundamental mode with an azimuthal number of 72 (TE72,1).
    Fig. 9. Simulation of the resonant mode change as a function of the microdisk deformation. (a) Simulated resonant mode of microdisk cavities with increasing deformation, indicating that the corresponding resonant wavelength exhibits a blue shift from 544.12 to 540.71 nm. (b) Simulated field distribution of the fundamental mode with an azimuthal number of 72 (TE72,1).
    Lasing actions from three deformed microdisks. (a)–(c) Power-dependent lasing spectra from three deformed microdisks, respectively. (d) and (e) Integrated emission intensity as a function of pump density showing the lasing threshold at ∼19.5, 9.7, and 6.1 μJ/cm2.
    Fig. 10. Lasing actions from three deformed microdisks. (a)–(c) Power-dependent lasing spectra from three deformed microdisks, respectively. (d) and (e) Integrated emission intensity as a function of pump density showing the lasing threshold at 19.5, 9.7, and 6.1  μJ/cm2.
    Similarity statistical image of twice measurement results of the PUF labels.
    Fig. 11. Similarity statistical image of twice measurement results of the PUF labels.
    Wangqi Mao, Xinyu Gao, Bo Li, Yaqiang Zhang, Pei Wang, Hongxing Dong, Long Zhang. Randomized whispering-gallery-mode microdisk laser arrays via cavity deformations for anti-counterfeiting labels[J]. Photonics Research, 2023, 11(7): 1227
    Download Citation