• Chinese Optics Letters
  • Vol. 17, Issue 4, 041601 (2019)
Menglin Chen1, Zhijun Luo1, Yanan Liu1, and Zongsong Gan1、2、3、*
Author Affiliations
  • 1Wuhan National Laboratory for Optoelectronics, Huazhong University of Science and Technology, Wuhan 430074, China
  • 2Key Laboratory of Information Storage Systems, Ministry of Education, Huazhong University of Science and Technology, Wuhan 430074, China
  • 3Shenzhen Research Institute of Huazhong University of Science and Technology, Shenzhen 518057, China
  • show less
    DOI: 10.3788/COL201917.041601 Cite this Article Set citation alerts
    Menglin Chen, Zhijun Luo, Yanan Liu, Zongsong Gan. Fractional density of states and the overall spontaneous emission control ability of a three-dimensional photonic crystal[J]. Chinese Optics Letters, 2019, 17(4): 041601 Copy Citation Text show less
    Measurement of SE decay lifetime for embedded emitters in a 3D PC based on a confocal imaging system. (a) A 3D woodpile PC frame diagram. (b) A measurement in a local zone reflects FDOS. (c) Schematic of signals from two local zones gives out different SE decay lifetime values.
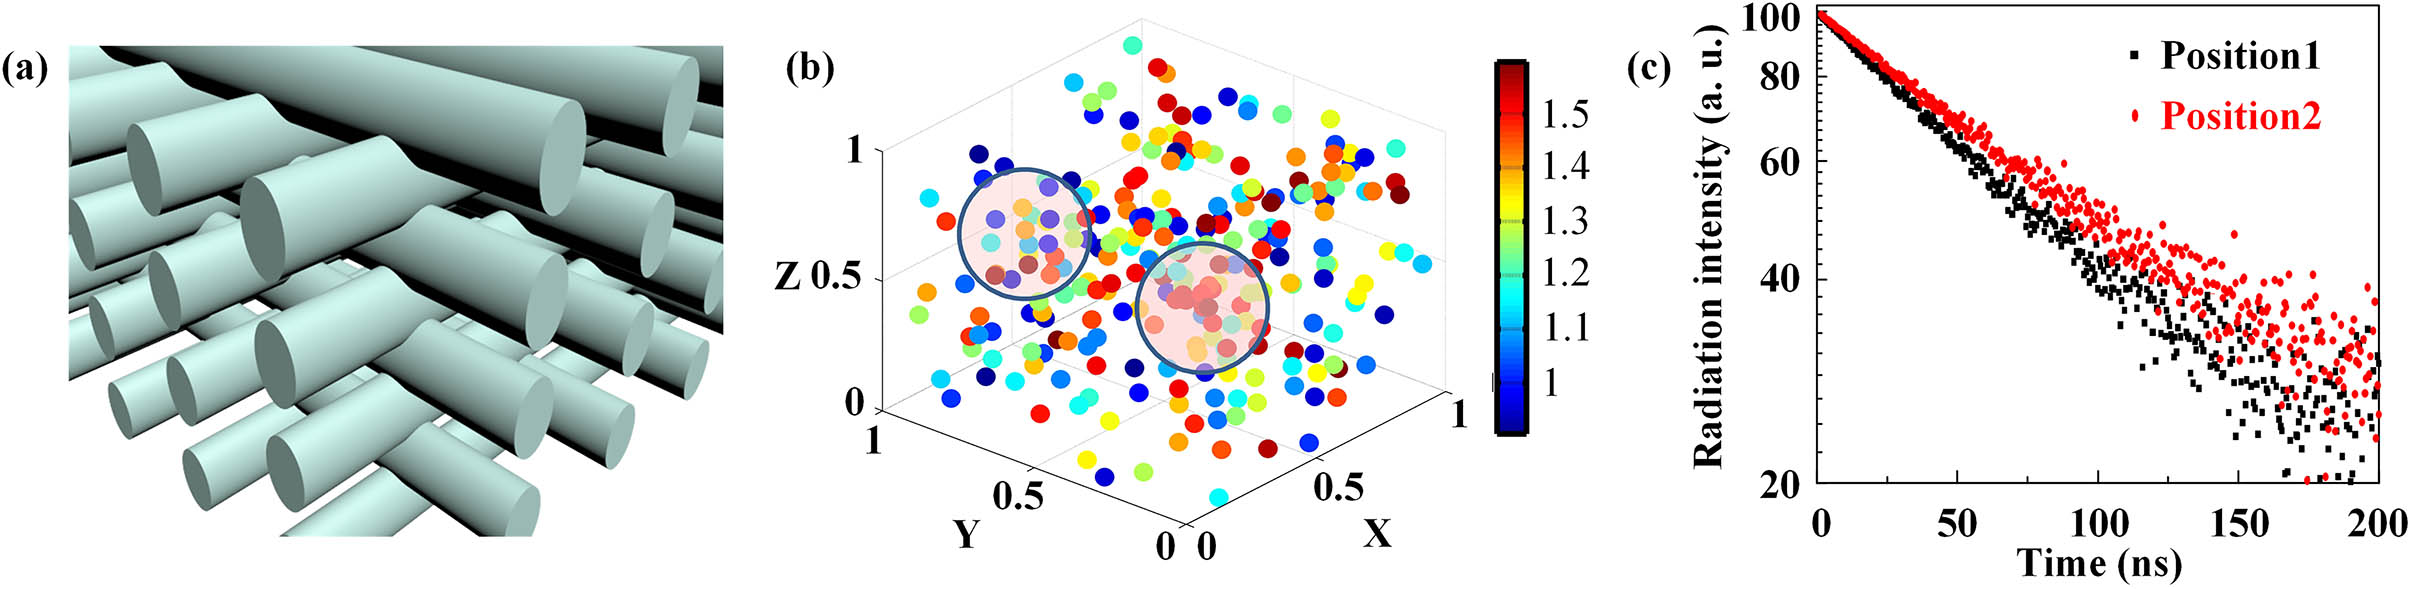
    Fig. 1. Measurement of SE decay lifetime for embedded emitters in a 3D PC based on a confocal imaging system. (a) A 3D woodpile PC frame diagram. (b) A measurement in a local zone reflects FDOS. (c) Schematic of signals from two local zones gives out different SE decay lifetime values.
    (a) Transmission spectra of the woodpile PC in the Γ-X direction before and after the QD attachment and the emission spectrum of the attached QDs with an emission peak wavelength matching the stopgap of the PC in the Γ-X direction. The shadow zone indicates the calculated wavelength range of the Γ-X direction stopgap. (b) Lifetime ratio distribution of 22,300 positions in a unit cell.
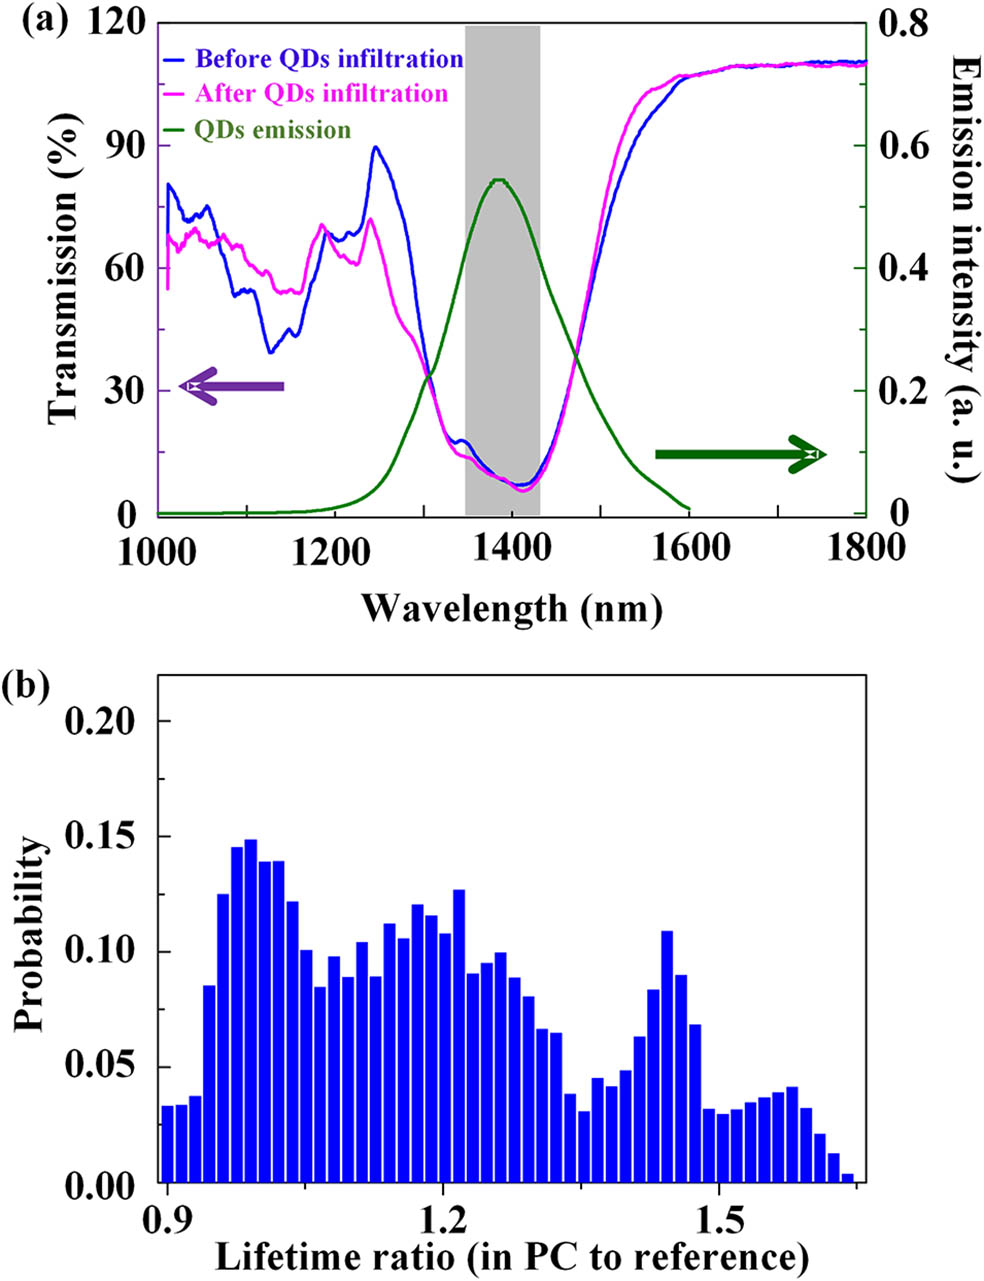
    Fig. 2. (a) Transmission spectra of the woodpile PC in the Γ-X direction before and after the QD attachment and the emission spectrum of the attached QDs with an emission peak wavelength matching the stopgap of the PC in the Γ-X direction. The shadow zone indicates the calculated wavelength range of the Γ-X direction stopgap. (b) Lifetime ratio distribution of 22,300 positions in a unit cell.
    Simulation of random excitation focal spot position averaged lifetime value ratio to the overall averaged lifetime value with different measurement times. (a) A typical average lifetime value ratio change with measurement times. (b) Lifetime ratio distribution of 2 measurement times for 10,000 times simulation. (c) Lifetime ratio distribution of 100 measurement times for 10,000 times simulation. (d) Confident up and down limits corresponding to 95% confident level vary with the measurement times with random excitation focal spot positions.
    Fig. 3. Simulation of random excitation focal spot position averaged lifetime value ratio to the overall averaged lifetime value with different measurement times. (a) A typical average lifetime value ratio change with measurement times. (b) Lifetime ratio distribution of 2 measurement times for 10,000 times simulation. (c) Lifetime ratio distribution of 100 measurement times for 10,000 times simulation. (d) Confident up and down limits corresponding to 95% confident level vary with the measurement times with random excitation focal spot positions.
    (a) Typical measured decay curves that are fitted with single exponential decay function for QDs in the PC and in the reference. (b) Distribution of the SE decay lifetime value for QDs inside the PC and in the reference.
    Fig. 4. (a) Typical measured decay curves that are fitted with single exponential decay function for QDs in the PC and in the reference. (b) Distribution of the SE decay lifetime value for QDs inside the PC and in the reference.
    Menglin Chen, Zhijun Luo, Yanan Liu, Zongsong Gan. Fractional density of states and the overall spontaneous emission control ability of a three-dimensional photonic crystal[J]. Chinese Optics Letters, 2019, 17(4): 041601
    Download Citation