
Meng YAO, Hai-shui WANG. To Make a Good Infrared Spectrum in NaCl Aqueous Solution Where Lambert-Beer’s Law is Not to be Obeyed[J]. Spectroscopy and Spectral Analysis, 2021, 41(1): 65
- Spectroscopy and Spectral Analysis
- Vol. 41, Issue 1, 65 (2021)
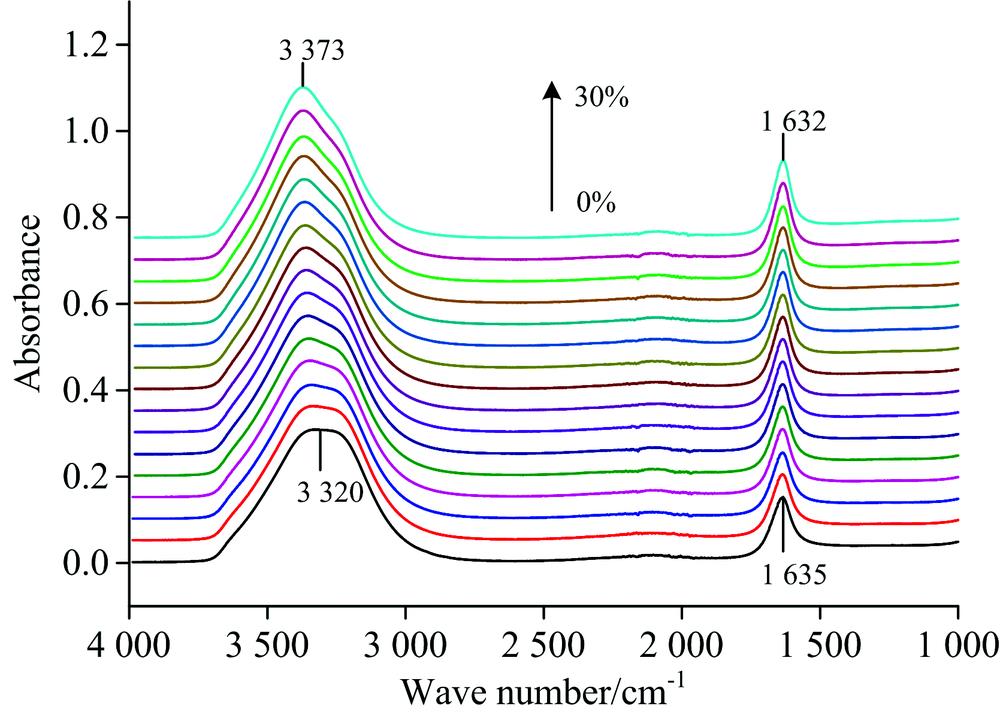
Fig. 1. FTIR spectra of NaCl aqueous solutions(0, 2%, 4%, …, 28%, 30%, step 2%)
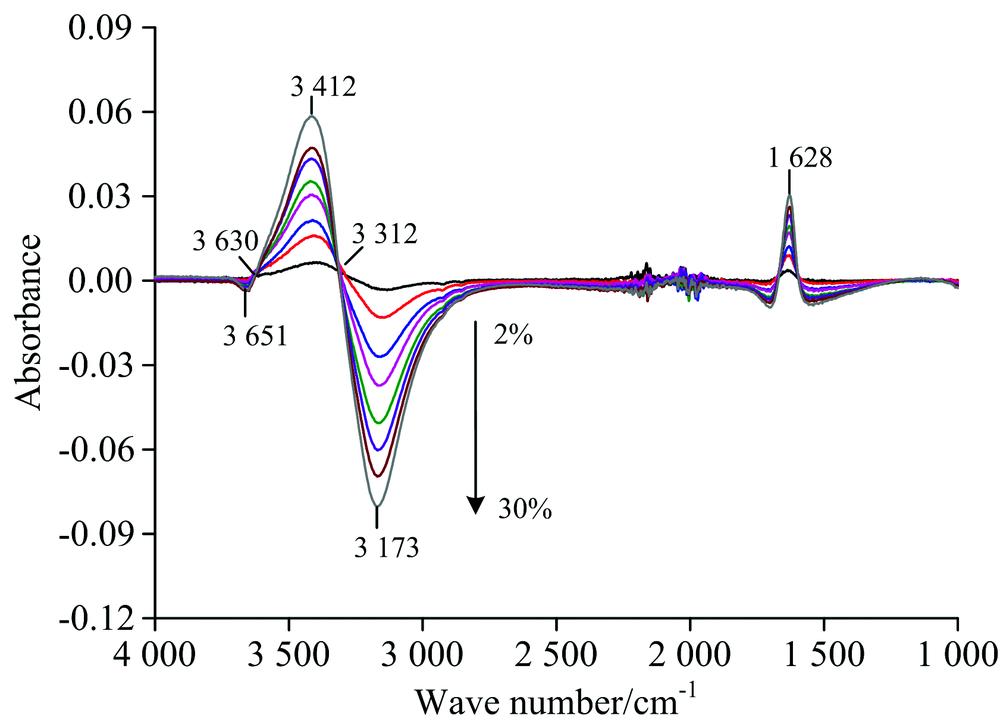
Fig. 2. The difference spectra between NaCl aqueous solution(2%, 6%, …, 26%, 30%, step 4%) and pure water, respectively
Fig. 3. The subtraction spectra between A 16% and different A ^ 16 % c 1, c 2)
a : ΔA 16%(14%, 18%); b : ΔA 16%(12%, 20%); c : ΔA 16%(10%, 22%); d : ΔA 16%(8%, 24%); e : ΔA 16%(6%, 26%); f : ΔA 16%(4%, 28%); g : ΔA 16%(2%, 30%)
Fig. 4. The subtraction spectra between A 16% and different Ah 16%(c 1, c 2)
a : ΔAh 16%(14%, 18%); b : ΔAh 16%(12%, 20%); c : ΔAh 16%(10%, 22%); d : ΔAh 16%(8%, 24%); e : ΔAh 16%(6%, 26%); f : ΔAh 16%(4%, 28%); g : ΔAh 16%(2%, 30%)
Fig. 5. The subtraction spectra between Ac and Ahc (2%, 30%)
a : ΔA h4%; b : ΔAh 6%; c : ΔAh 8%; d : ΔAh 10%; e : ΔAh 12%;f : ΔAh 14%; g : ΔAh 16%; h : ΔAh 18%; i : ΔAh 20%; j : ΔAh 22%;k : ΔAh 24%; l : ΔAh 26%; m : ΔAh 28%
Fig. 6. The fitting regression coefficient-c curves
(a):a ^ c curve; (b): b ^ c curve
(a):
Fig. 7. The real spectra (dashed line) and corresponding hybrid spectra (dotted line) of NaCl aqueous solutions
a : A 5% and Ah 5%(2%, 30%); b : A 13% and Ah 13%(2%, 30%);c : A 15% and Ah 15%(2%, 30%); d : A 19% and Ah 19%(2%, 30%);e : A 23% and Ah 23%(2%, 30%); f : A 25% and Ah 25%(2%, 30%)
|
Table 1. The binary linear regression equations between Ac and
|
Table 2. The significance test of linear regression effect of the regression equations between A16% and
|
Table 3. The hybrid spectra equations between Ahc and A2%, A30%
|
Table 4. The relationship among c, regression coefficient

Set citation alerts for the article
Please enter your email address
© Copyright 2018-2021 | Chinese Laser Press. All Rights Reserved 沪ICP备15018463号-20