Author Affiliations
1School of Materials Science and Engineering, Tianjin University, Tianjin 300350, China2College of Life Science and Biotechnology, MianYang Teachers’ College, Mianyang 621006, China;3Key Laboratory of Mechanism Theory and Equipment Design of Ministry of Education, School of Mechanical Engineering, Tianjin University, Tianjin 300354, Chinashow less
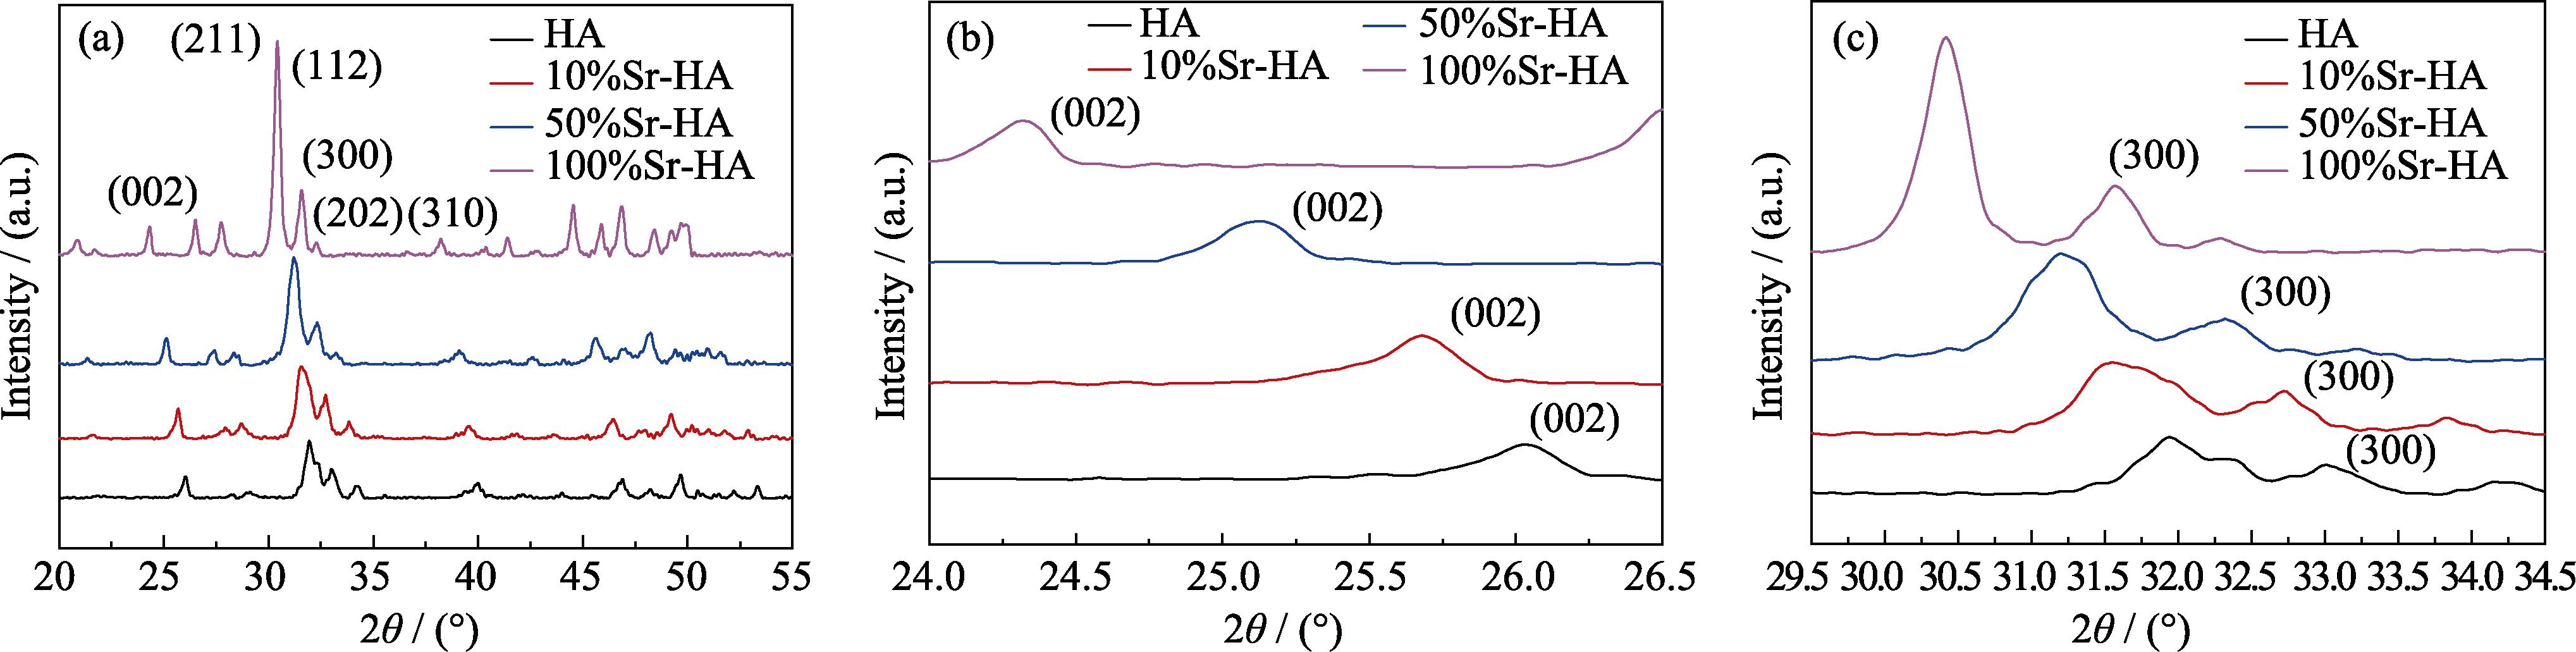
1. (a) XRD patterns of HA and Sr-doped HA nanoparticles with (b) magnified (200) peaks, and (c) (300) peaks
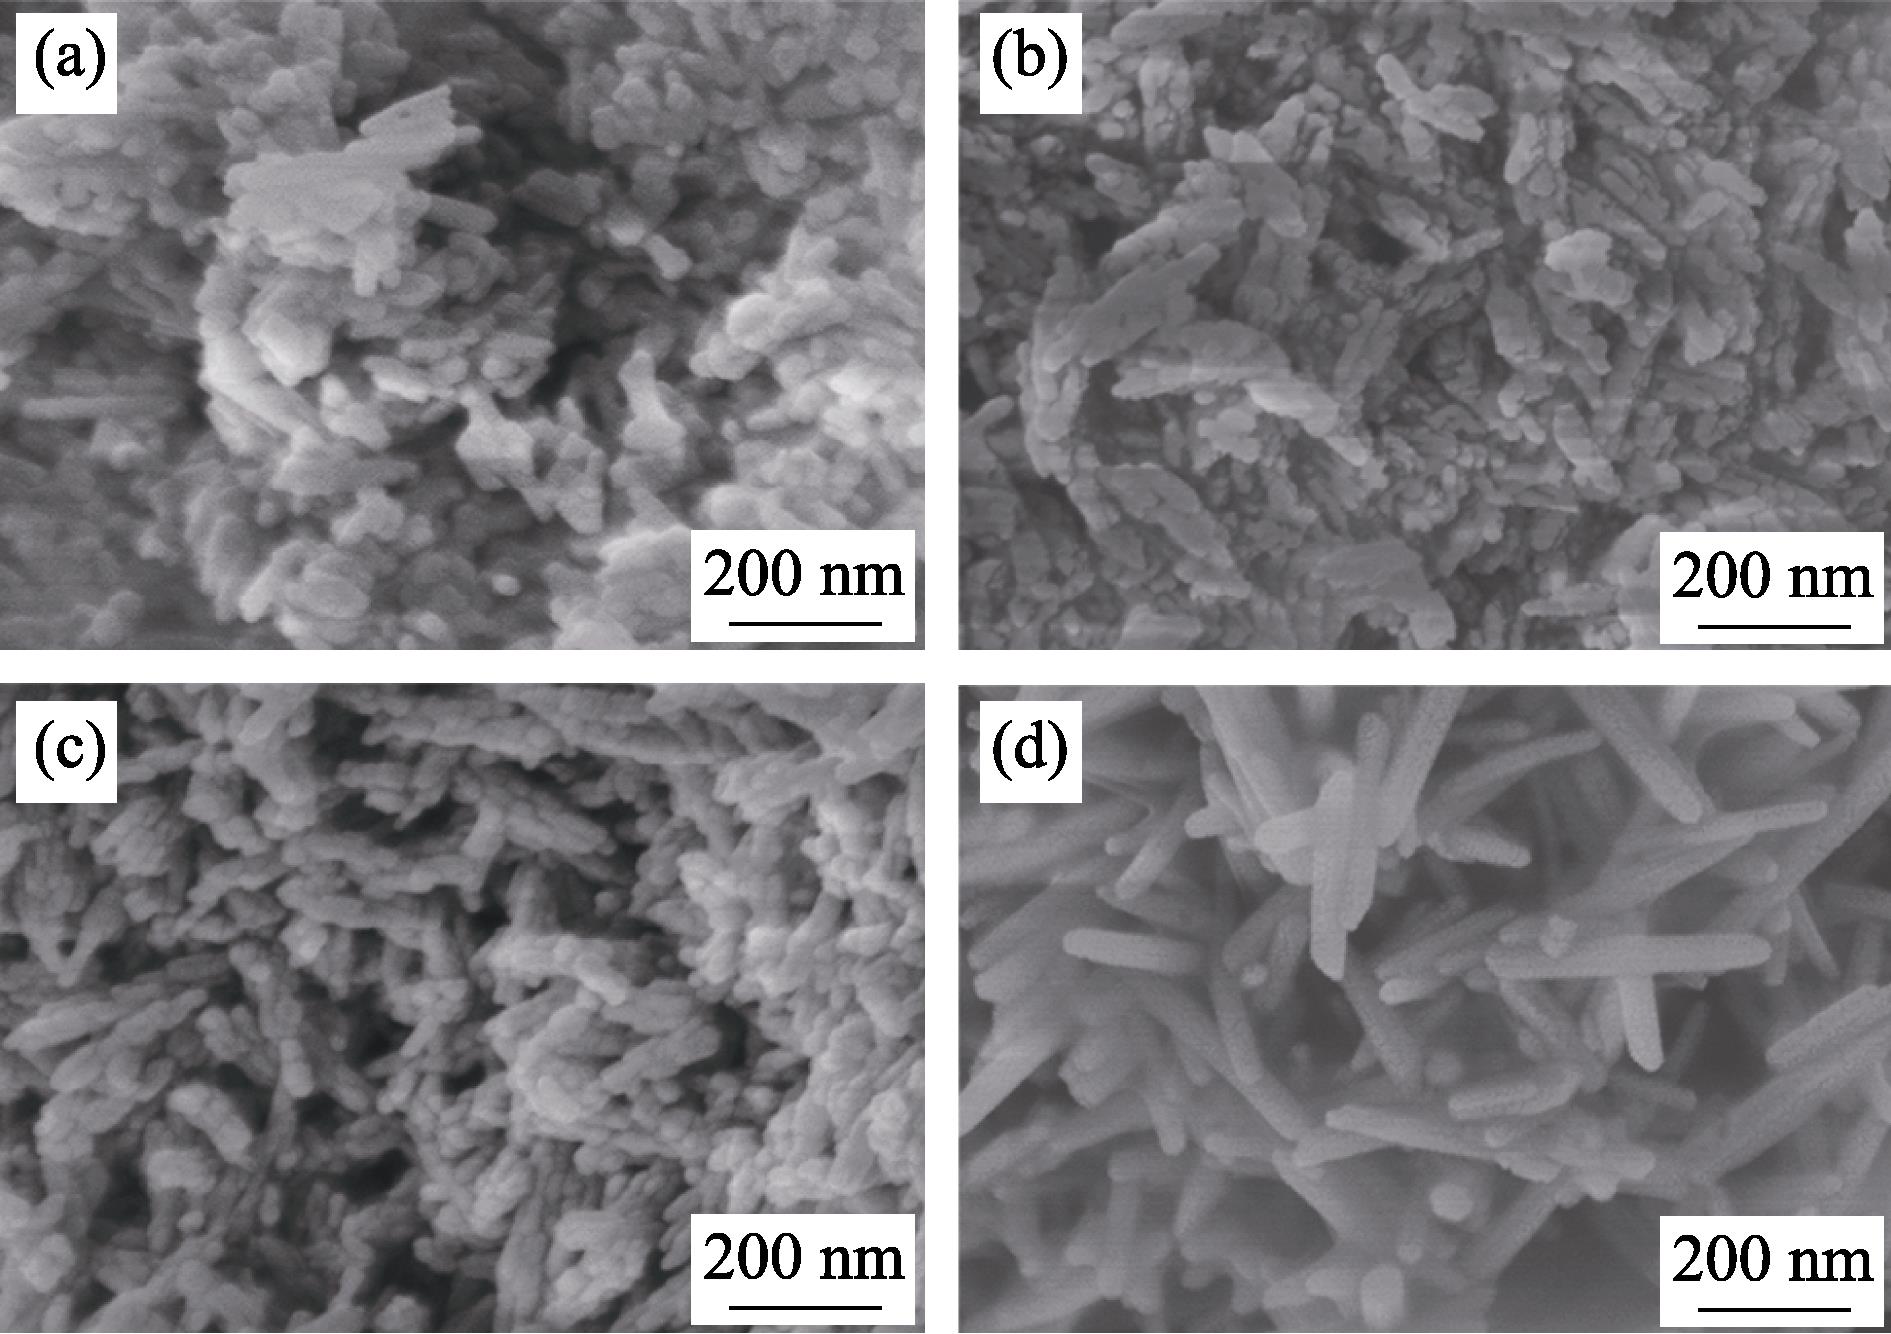
2. SEM images of HA and Sr-doped HA nanoparticles (a) HA; (b) 10%Sr-HA; (c) 50%Sr-HA; (d) 100%Sr-HA
3. Morphology of Sr doped HA
4. SAED patterns of samples with different Sr concentrations (a) HA; (b) 10%Sr-HA; (c) 50%Sr-HA; (d) 100%Sr-HA
5. Unit cell of (a) HA, (b) 1Sr-Ca(1)-HA, (c) 2Sr-Ca(1)- 3Sr-Ca(2)-HA, (d) 10Sr-HA after structural optimization Calcium (1): light blue; Calcium (2): green; Strontium: dark blue; Phosphorus: pink; Oxygen: red; Hydrogen: white
S1. The unit cell of (a) 1Sr-Ca(2)-HA, (b) 4Sr-Ca(1)-1Sr-Ca(2)-HA, (c) 3Sr-Ca(1)-2Sr-Ca(2)-HA, (d) 1Sr-Ca(1)-4Sr-Ca(2)-HA, (e) 5Sr-Ca(2)-HA after structural optimization. Color codes: Calcium (1): light blue, Calcium (2): green, Strontium: dark blue, Phosphorus: pink, Oxygen: red, Hydrogen: white
Sample | Ca/mol% | Sr/mol% | P/mol% | n(Ca+Sr)/n(P) | n(Ca)/n(P) | n(Sr)/n(P) | n(Sr)/n(Ca+Sr) |
---|
HA | 62.02 | 0.03 | 37.95 | - | 1.634 | - | - | 10%Sr-HA | 55.98 | 5.64 | 38.38 | 1.605 | 1.459 | 0.147 | 0.092 | 50%Sr-HA | 31.85 | 30.59 | 37.56 | 1.662 | 0.847 | 0.814 | 0.490 | 100%Sr-HA | 0.05 | 63.85 | 36.10 | - | - | 1.769 | - |
|
Table 1. Chemical composition of nanoparticles measured by EDS
Sample | Ca/mol% | Sr/mol% | P/mol% | n(Ca+Sr)/n(P) | n(Ca)/n(P) | n(Sr)/n(P) | n(Sr)/n(Ca+Sr) |
---|
HA | 62.19 | 0.06 | 37.75 | - | 1.647 | - | - | 10%Sr-HA | 56.49 | 5.77 | 37.74 | 1.649 | 1.497 | 0.153 | 0.093 | 50%Sr-HA | 31.85 | 30.57 | 37.58 | 1.660 | 10.848 | 0.813 | 0.490 | 100%Sr-HA | 0.08 | 62.26 | 37.66 | - | - | 1.653 | - |
|
Table 2. Element content of nanoparticles measured by ICP
Sample | Crystallinity | 2θ(002)/(°) | 2θ(300)/(°) | a/nm | c/nm |
---|
HA | 53.3% | 26.07 | 33.09 | 0.93679 | 0.68286 | 10%Sr-HA | 51.1% | 25.68 | 32.76 | 0.94625 | 0.69326 | 50%Sr-HA | 49.4% | 25.12 | 32.34 | 0.95814 | 0.71056 | 100%Sr-HA | 73.7% | 24.34 | 31.58 | 0.98058 | 0.73071 |
|
Table 3. Lattice parameters and crystallinity of nanoparticles obtained by XRD
Method | Model | a/nm | b/nm | c/nm | V/nm3 | Formation energy/eV |
---|
DFT | HA | 0.9642 | 0.9642 | 0.6853 | 5517 | | 1Sr-1Ca(1)-HA | 0.9695 | 0.9695 | 0.6910 | 5595 | -0.307 | 1Sr-1Ca(2)-HA | 0.9717 | 0.9727 | 0.6897 | 5603 | -0.250 | 4Sr-4Ca(1)-1Sr-1Ca(2)-HA | 0.9724 | 0.9744 | 0.7219 | 5879 | -0.404 | 3Sr-3Ca(1)-2Sr-2Ca(2)-HA | 0.9765 | 0.9799 | 0.7159 | 5897 | -0.346 | 2Sr-2Ca(1)-3Sr-3Ca(2)-HA | 0.9778 | 0.9841 | 0.7117 | 5891 | -0.557 | 1Sr-1Ca(1)-4Sr-4Ca(2)-HA | 0.9788 | 0.9869 | 0.7108 | 5894 | -0.369 | 5Sr-5Ca(2)-HA | 0.9809 | 0.9861 | 0.7113 | 5906 | -0.259 | 10Sr-HA | 0.9922 | 0.9922 | 0.7361 | 6274 | -0.321 | Experiment | HA | 0.9368 | - | 0.6829 | - | - | 10%Sr-HA | 0.9463 | - | 0.6933 | - | - | 50%Sr-HA | 0.9581 | - | 0.7106 | - | - | 100%Sr-HA | 0.9806 | - | 0.7307 | - | - |
|
Table 4. Lattice parameters and formation energy calculated by DFT method and lattice parameters (a & c) obtained from experiments