
Zihang ZHOU, Qun WANG, Xiang GE, Zhaoyang LI. Strontium Doped Hydroxyapatite Nanoparticles: Synthesis, Characterization and Simulation [J]. Journal of Inorganic Materials, 2020, 35(11): 1283
- Journal of Inorganic Materials
- Vol. 35, Issue 11, 1283 (2020)
Abstract
Hydroxyapatite (HA) has been widely used as a bioceramic with good biological activity. HA plays an important role in dental and bone regeneration due to its superior biocompatibility and excellent ability to bond bone tissue [
Sr is proved to be one of the most constituent elements in bones. It has been extensively utilized to endow HA with better performances, such as higher biocompatibility and bioactivity, due to its excellent biocompatibility[
Although there have been many theoretical and experimental studies on Sr doping into HA structure, few studies have combined theory with experimental results. In this study, a hydrothermal method was used to synthesize the pure HA and Sr doped (10at%, 50at%, 100at%) HA nanoparticles. Scanning electron microscopy (SEM), X-ray diffraction (XRD), high-resolution transmission electron microscopy (HRTEM), and selected-area electron diffraction (SAED) were employed to provide the morphology, crystallinity, and microstructure of the samples. Ab initio method which is based on quantum mechanics provided the lattice parameters and formation energy according to Sr doping concentrations. The preference sites of Sr ions doping for Ca at 10at% and 50at% concentration were also discussed.
1 Materials and methods
1.1 Preparation of HA and Sr-HA
HA (Ca10(PO4)6(OH)2) and Sr-doped HA (Ca10-xSrx(PO4)6(OH)2, x=0-10) nanoparticles with Sr concentrations at 10at%, 50at%, 100at% (x=1, 5, 10) were prepared by a hydrothermal method. Calcium nitrate tetrahydrate (Ca(NO3)2·4H2O), strontium nitrate (Sr(NO3)2), and diammonium hydrogen phosphate ((NH4)2HPO4) were utilized as Ca, Sr, and P sources, respectively. Preparation procedure of 2 g of 50at% Sr-doped HA was as follows: 1.9 g of Ca(NO3)2·4H2O, 1.703 g of Sr(NO3)2, and 1.275 g of (NH4)2HPO4 were dissolved into 60 mL deionized water. Then, 25% ammonia solution was used to adjust the pH between 10 and 10.5. After stirring the mixture for 5 min, it was injected into a hydrothermal reactor and aged at 150 ℃ for 6 h. The precipitates obtained by centrifugation were cleaned three times with distilled water and anhydrous ethanol. Finally, the products were dried at 70 ℃ for 12 h.
1.2 Characterization of the samples
Lattice parameters (a and c) were quantified from peaks of (002) and (211) in an XRD pattern, respectively, using the standard hexagonal close packed unit cell plane spacing relationship[
where d is the distance between two adjacent planes in the set of Miller indices (hkl).
The degree of crystallinity[
where I300 is the intensity of (300) reflection and V112/300 is the intensity of the hollow between (112) and (300) reflections, which completely disappears in non-crystalline samples.
Composition of individual apatite crystals was examined by X-ray energy dispersive spectrometer (EDS) equipped on SEM. The atomic concentrations of elements (Ca, P, and Sr) in the nanoparticles were further determined by an inductive coupled plasma emission spectrometer (ICP; VISTA-MAX) method.
Surface morphology of the synthesized HA nanoparticles were observed by SEM (HITACHI S-4800, Tokyo, Japan) at an accelerating voltage of 5 kV. The phase analysis was carried out using X-ray powder diffraction instrument (RIGAKU/DMAX). The patterns were recorded using CuKα radiation in the 2θ range of 10-90° at the step size of 0.02° with the scan speed of 8 (°)/min.
The microstructures of nanoparticles were examined by TEM for comparing with XRD results. TEM images were taken using a JEM-2100F microscope at 200 kV. HRTEM images and SAED patterns were also obtained.
1.3 Computational method
The calculations were carried out using the CASTEP module in the Materials Studio software package. The CASTEP code is an ab initio program which can calculate ground state energies of atomic systems accurately based on DFT. The two types of Ca sites [Ca(1) or Ca(2)], with four Ca(1) sites surrounded by nine oxygen atoms and six Ca(2) sites positioning around the OH groups, can be substituted by other doping cations. Based on the unit cell of HA, eight possible Sr-doped HA models were built.
1Sr-Ca(1)-HA model: One Ca(1) was replaced by one Sr atom in pure HA.
4Sr-Ca(1)-1Sr-Ca(2)-HA model: Four Ca(1) were replaced by four Sr atoms and one Ca(2) was replaced by one Sr atom in pure HA.
Similarly, 1Sr-Ca(2)-HA, 3Sr-Ca(1)-2Sr-Ca(2)-HA, 2Sr-Ca(1)-3Sr-Ca(2)-HA, 1Sr-Ca(1)-4Sr-Ca(2)-HA, 5Sr-Ca(2)-HA and 10Sr-HA models were built. The stable models after geometric optimization (pure HA, 1Sr-Ca(1)-HA, 2Sr-Ca(1)-3Sr-Ca(2)-HA and 10Sr-HA) are optimized.
All calculations of structure optimization were conducted by the generalized gradient approximation (GGA) of the Perdew-Burke-Ernzerhof (PBE) exchange-correlation which was based on an energy minimization principle. The electronic ground state was achieved using a conjugate. The Broyden-Fletcher-Goldfarb-Shanno (BFGS) was utilized to relax the atomic structure. The cutoff energy of the plane waves which was set as 380 eV and the Brillouin zone samplings with a k-point grid of 4×4×4 samplings were sufficient to guarantee the convergence of total energy. The convergence criteria of geometric optimization and energy were set to (a) a self-consistent field tolerance of 10-6 eV/atom, (b) an energy tolerance of 10-5 eV/atom, (c) a maximum force tolerance of 0.3 eV/nm, (d) a maximum stress tolerance of 0.05 GPa, and (e) a maximum displacement tolerance of 10-4 nm. The cell sizes and atomic positions were fully relaxed without any constraints in the process of DFT calculation.
To determine the most stable Sr-doped HA models, the formation energies of different substitution models were calculated by DFT method. The formation energy was evaluated by the following equation[
where EHA is the energy of perfect HA and Edoped-HA is the energy of doped-HA. ni denotes the numbers of the corresponding ionic species to be removed from (ni>0) or added (ni<0) to the HA unit cell. The chemical potentials for Ca2+ and Sr2+ are given by μCa and μSr, respectively. In this study, the chemical potentials are approximated by their energies at 0 K.
| Sample | Ca/mol% | Sr/mol% | P/mol% | ||||
|---|---|---|---|---|---|---|---|
| HA | 62.02 | 0.03 | 37.95 | - | 1.634 | - | - |
| 10%Sr-HA | 55.98 | 5.64 | 38.38 | 1.605 | 1.459 | 0.147 | 0.092 |
| 50%Sr-HA | 31.85 | 30.59 | 37.56 | 1.662 | 0.847 | 0.814 | 0.490 |
| 100%Sr-HA | 0.05 | 63.85 | 36.10 | - | - | 1.769 | - |
Table 1.
Chemical composition of nanoparticles measured by EDS
2 Results and discussion
2.1 Chemical composition
Atomic concentrations of Ca, Sr, and P in the nanoparticles were examined by EDS, and the element content was further confirmed by ICP, as listed in Table 1 and Table 2. The results obtained by EDS and ICP were consistent. The ratios of various elements were nearly the same as the raw ratios before the hydrothermal synthesis. The molar ratios of Ca/P in HA and (Ca+Sr)/P in Sr-HA were around 1.67 which was close to the stoichiometric number of pure HA without any significant change after addition of Sr ions, which is similar to previous studies[
| Sample | Ca/mol% | Sr/mol% | P/mol% | ||||
|---|---|---|---|---|---|---|---|
| HA | 62.19 | 0.06 | 37.75 | - | 1.647 | - | - |
| 10%Sr-HA | 56.49 | 5.77 | 37.74 | 1.649 | 1.497 | 0.153 | 0.093 |
| 50%Sr-HA | 31.85 | 30.57 | 37.58 | 1.660 | 10.848 | 0.813 | 0.490 |
| 100%Sr-HA | 0.08 | 62.26 | 37.66 | - | - | 1.653 | - |
Table 2.
Element content of nanoparticles measured by ICP
2.2 Analysis of XRD patterns
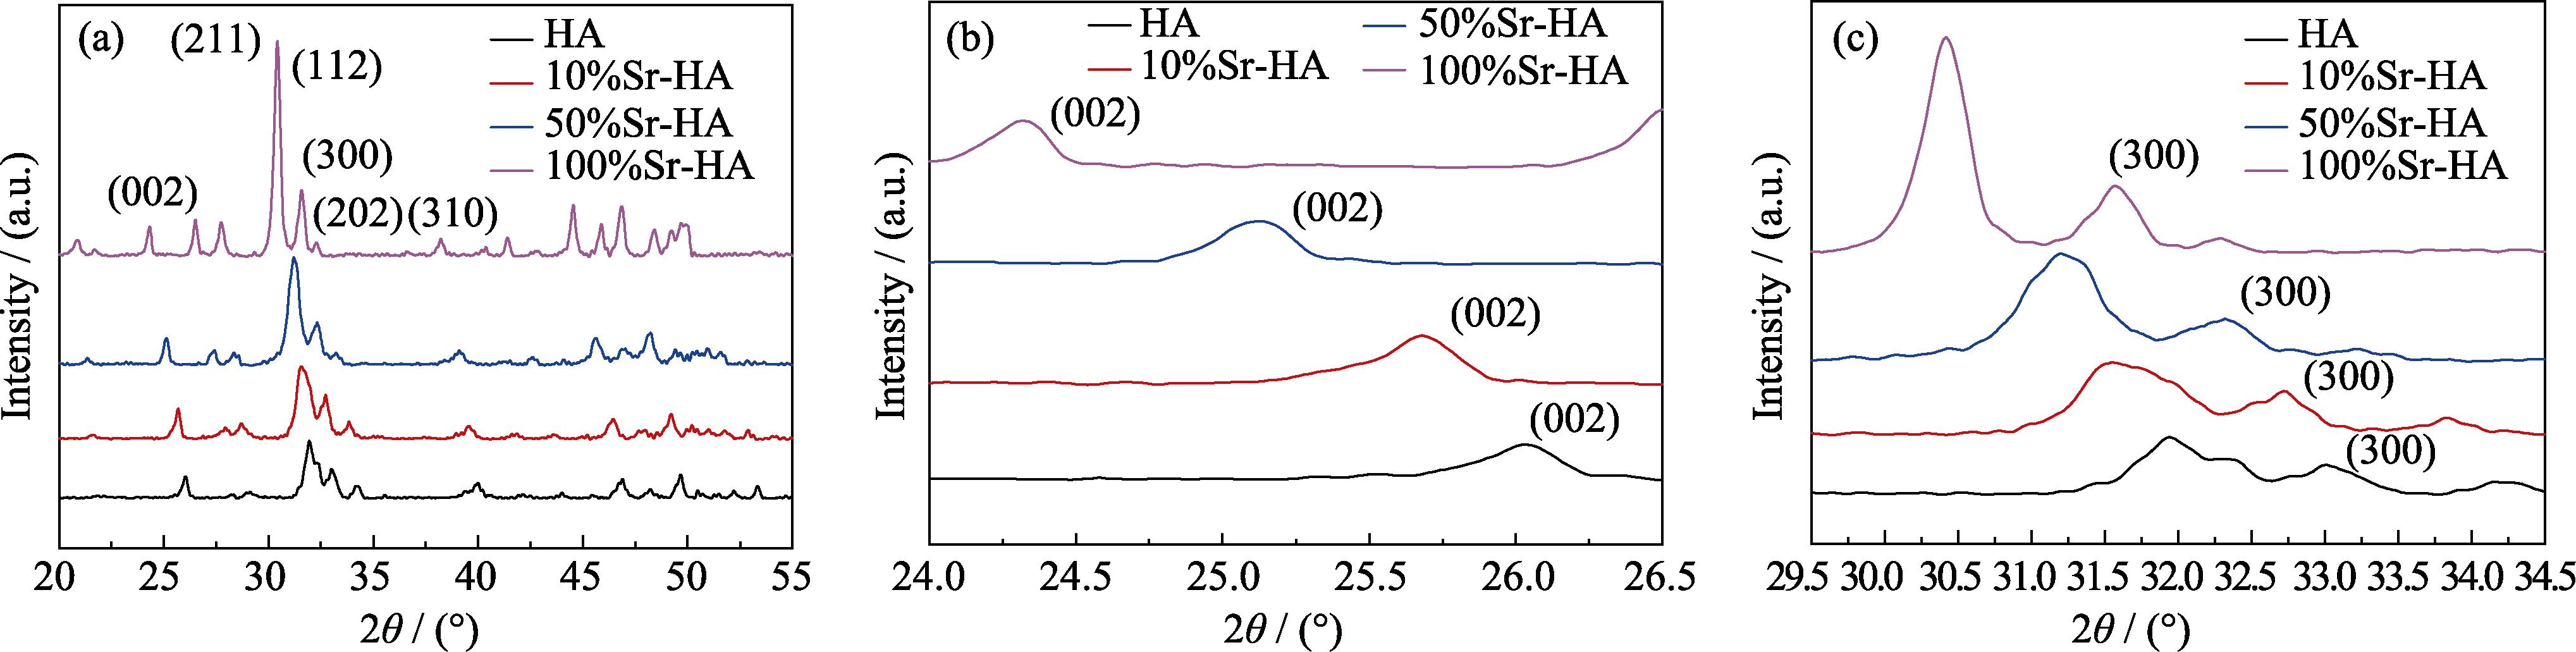
The XRD patterns of particles with different Sr doping concentrations from 0 to 100at% are shown in Fig. 1. The diffraction peaks of (002) and (300) shifted to a low 2θ value with gradual addition of Sr ions, illustrating an increase of lattice parameters (a and c) and d-spacings. This is because radius of Sr ion (0.118 nm) is larger than the radius of Ca ion (0.099 nm). These results were in line with those of previous studies[
![]()
Figure 1.(a) XRD patterns of HA and Sr-doped HA nanoparticles with (b) magnified (200) peaks, and (c) (300) peaks
2.3 Morphology by SEM observation
Fig. 2 clearly shows the morphologies of HA and Sr-doped HA nanoparticles. Agglomeration phenomenon occurred in all types of nanoparticles. The pure HA nanoparticles were rod-like. When the doped concentration of Sr increased from 10at% to 50at%, the morphology of Sr-doped HA did not change significantly compared with the pure HA. With the increase of Sr doping concentration, the crystal length increased, and the 100% Sr-HA nanoparticles presented rod-like shape and the largest crystal size. Geng et al.[
![]()
Figure 2.SEM images of HA and Sr-doped HA nanoparticles (a) HA; (b) 10%Sr-HA; (c) 50%Sr-HA; (d) 100%Sr-HA
| Sample | Crystallinity | 2 | 2 | ||
|---|---|---|---|---|---|
| HA | 53.3% | 26.07 | 33.09 | 0.93679 | 0.68286 |
| 10%Sr-HA | 51.1% | 25.68 | 32.76 | 0.94625 | 0.69326 |
| 50%Sr-HA | 49.4% | 25.12 | 32.34 | 0.95814 | 0.71056 |
| 100%Sr-HA | 73.7% | 24.34 | 31.58 | 0.98058 | 0.73071 |
Table 3.
Lattice parameters and crystallinity of nanoparticles obtained by XRD
2.4 Morphology and microstructure by TEM observation
TEM and SAED images of HA and all types of Sr-doped HA nanoparticles are displayed in Fig. 3 and Fig. 4. Fig. 3(a, b) show the morphologies of pure HA nanoparticles. Pure HA displays regular shape and the nanoparticles display rod-like shape. Lengths of most nanoparticles vary from 27.5 to 153.2 nm and the widths of them are between 13 and 27.6 nm. Aspect ratios of crystals are between 2.11 and 7.83. There are no regular morphologies for 10%Sr-HA nanoparticles (Fig. 3(d, e)), which reveals that the crystal structure of HA was distorted because of the doping of Sr ions. As the content of doped Sr increasing to 50%, the irregular crystal size further increased. There was no statistical data about lengths, widths, and aspect ratios of the 10%Sr-HA and 50%Sr-HA nanoparticles due to their irregular shapes. When Sr ions completely replace Ca ions in HA, most of the nanoparticles regain regular shapes as shown in Fig. 3(j, k). The lengths and aspect ratios of the 100%Sr-HA nanoparticles increased significantly compared to those of other three types of nanoparticles, which are consistent with the results obtained by SEM observation. Most of the 100% Sr-HA nanoparticles are between 164.7 and 406.2 nm in length and between 25.5 and 53.9 nm in width. Their aspect ratios varied from 4.33 to 11.01. Morphologies of all types of nanoparticles are consistent with the previous studies[
HRTEM images corresponding to each type of nanoparticle (Fig. 3(c, f, i, l)) were used to analyze the crystal plane d-spacing and crystallinity changes of nanoparticles. Pure HA or Sr-doped HA nanoparticles exhibited good crystallinity, as proved by XRD. In pure HA nanoparticles, most of the observed crystal planes were (002) which had a d-spacing of 0.34 nm, and was perpendicular to c axis, in consistent with previous study[
![]()
Figure 3.Morphology of Sr doped HA
(a, b) TEM images of HA; (c) HRTEM image of HA; (d, e) TEM images of 10%Sr-HA; (f) HRTEM image of 10%Sr-HA; (g, h) TEM images of 50%Sr-HA; (i) HRTEM image of 50%Sr-HA; (j, k) TEM images of 100%Sr-HA; (l) HRTEM image of 100%Sr-HA. Scale bars
![]()
Figure 4.SAED patterns of samples with different Sr concentrations (a) HA; (b) 10%Sr-HA; (c) 50%Sr-HA; (d) 100%Sr-HA
2.5 DFT results
The unit cells of nine Sr-doped HA models after structure optimization are shown in Fig. 5 and Fig. S1. The calculation results obtained by the DFT method are shown in Table 4. To explore the effect of Sr ions doping into HA crystal structures, the lattice parameters of pure HA unit cell were calculated for comparison. Simulation results well confirmed the accuracy of the experimental ones.
![]()
Figure 5.Unit cell of (a) HA, (b) 1Sr-Ca(1)-HA, (c) 2Sr-Ca(1)- 3Sr-Ca(2)-HA, (d) 10Sr-HA after structural optimization Calcium (1): light blue; Calcium (2): green; Strontium: dark blue; Phosphorus: pink; Oxygen: red; Hydrogen: white
The lattice parameters (a-c) obtained by the simulation method were slightly larger than those provided by the experiment method, as shown in Table 4. Lattice parameters (both a and c) of all types of Sr-doped HA unit cells distinctly increased with increasing Sr concentrations, no matter which sites [Ca(1) or Ca(2)] were substituted by Sr ions. For 10%Sr-HA models, the lattice parameters a, b, and c of 1Sr-Ca(2)-HA and 1Sr-Ca(1)-HA models were larger than those of pure HA model. For 50%Sr-HA and 100%Sr-HA models, the results were roughly the same as that of the 10%Sr-HA model and in line with the previous studies[
| Method | Model | Formation energy/eV | ||||
|---|---|---|---|---|---|---|
| DFT | HA | 0.9642 | 0.9642 | 0.6853 | 5517 | |
| 1Sr-1Ca(1)-HA | 0.9695 | 0.9695 | 0.6910 | 5595 | -0.307 | |
| 1Sr-1Ca(2)-HA | 0.9717 | 0.9727 | 0.6897 | 5603 | -0.250 | |
| 4Sr-4Ca(1)-1Sr-1Ca(2)-HA | 0.9724 | 0.9744 | 0.7219 | 5879 | -0.404 | |
| 3Sr-3Ca(1)-2Sr-2Ca(2)-HA | 0.9765 | 0.9799 | 0.7159 | 5897 | -0.346 | |
| 2Sr-2Ca(1)-3Sr-3Ca(2)-HA | 0.9778 | 0.9841 | 0.7117 | 5891 | -0.557 | |
| 1Sr-1Ca(1)-4Sr-4Ca(2)-HA | 0.9788 | 0.9869 | 0.7108 | 5894 | -0.369 | |
| 5Sr-5Ca(2)-HA | 0.9809 | 0.9861 | 0.7113 | 5906 | -0.259 | |
| 10Sr-HA | 0.9922 | 0.9922 | 0.7361 | 6274 | -0.321 | |
| Experiment | HA | 0.9368 | - | 0.6829 | - | - |
| 10%Sr-HA | 0.9463 | - | 0.6933 | - | - | |
| 50%Sr-HA | 0.9581 | - | 0.7106 | - | - | |
| 100%Sr-HA | 0.9806 | - | 0.7307 | - | - |
Table 4.
Lattice parameters and formation energy calculated by DFT method and lattice parameters (a & c) obtained from experiments
Negative formation energy of all types of Sr-doped HA models suggested that Sr doping enhanced the stability of the apatite crystal structure. For 10at% Sr-HA models, results of formation energy showed that 1Sr-Ca(1)-HA model was more stable than 1Sr-Ca(2)-HA model. At 10at% doping concentration, Sr2+ was more likely to replace Ca2+ ion at Ca(1) position. Therefore, Ca(1) site was the preferential site for Sr doping at 10%Sr concentration, which was in line with the previous report[
3 Conclusions
In this work, HA, 10%Sr-HA, 50%Sr-HA, and 100%Sr-HA were prepared by a hydrothermal synthesis method. The conclusions can be drawn as follows:
1) All HA and Sr-doped HA nanoparticles have good crystallinity and show polycrystalline properties. Crystallinity of 10%Sr-HA and 50%Sr-HA are lower than that of pure HA. When Sr concentration reaches 100at%, the crystallinity becomes the highest.
2) Lattice parameters a and c of HA unit cell increases with increasing concentration of Sr ions. Stabilities of the Sr-HA nanoparticles enhance with the doping of Sr ions due to their negative formation energy. The 2Sr-2Ca(1)- 3Sr-3Ca(2)-HA model is more stable than the others because of its minimum formation energy.
Supporting materlals:
Supporting materlals related to this article can be found at
![]()
Figure S1.The unit cell of (a) 1Sr-Ca(2)-HA, (b) 4Sr-Ca(1)-1Sr-Ca(2)-HA, (c) 3Sr-Ca(1)-2Sr-Ca(2)-HA, (d) 1Sr-Ca(1)-4Sr-Ca(2)-HA, (e) 5Sr-Ca(2)-HA after structural optimization. Color codes: Calcium (1): light blue, Calcium (2): green, Strontium: dark blue, Phosphorus: pink, Oxygen: red, Hydrogen: white
References


Set citation alerts for the article
Please enter your email address

© Copyright 2018-2021 | Chinese Laser Press. All Rights Reserved 沪ICP备15018463号-20