
Yan-de LIU, Jun LIAO, Bin LI, Xiao-gang JIANG, Ming-wang ZHU, Jin-liang YAO, Qiu WANG. Robustness of Global Model of Soluble Solids in Gongli Pear Based on Near-Infrared Spectroscopy[J]. Spectroscopy and Spectral Analysis, 2022, 42(9): 2781
- Spectroscopy and Spectral Analysis
- Vol. 42, Issue 9, 2781 (2022)
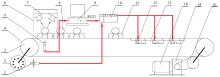
Fig. 1. Schematic diagram of on-line detection equipment for fruit internal quality by near infrared diffuse transmission spectroscopy
1: Porximity switch; 2: Coding mask; 3: Chain wheel; 4: Link chain; 5: Optica fiber; 6: Camera bellows; 7: Optical source; 8: Specimen; 9: Terminal PC; 10: PLC control cabinet; 11: Fruit cup; 12: Bionic boot; 13: Grading export; 14: Electromotor; 15: Reducer; 16: Drive sprocket
1: Porximity switch; 2: Coding mask; 3: Chain wheel; 4: Link chain; 5: Optica fiber; 6: Camera bellows; 7: Optical source; 8: Specimen; 9: Terminal PC; 10: PLC control cabinet; 11: Fruit cup; 12: Bionic boot; 13: Grading export; 14: Electromotor; 15: Reducer; 16: Drive sprocket
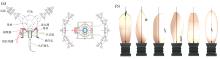
Fig. 2. Diffuse transmission testing mechanism (a), Gongli placement position (b)
Fig. 3. Establishment of local model and global model and experimental verification scheme
Fig. 4. Average spectra of fruit No.11 in six directions
Fig. 5. Scatter plot of omnidirectional verification
|
Table 1. Range, standard deviation and average value of SSC content in calibration set and prediction set
| ||||||||||||||||||||||||||||||||||||||||||||||||||||||||||||||||||||||||||||||||||||||||||||||||||||||||||||||||||||||||||||||||||||||||||||||||||||||||||
Table 2. Local model and local prediction effect in six directions
| ||||||||||||||||||||||||||||||||||||||||||||||
Table 3. Global model and prediction effect of A3, A4 and A5 directions
| ||||||||||||||||||||||||||||||||||||||||||||||
Table 4. Global model and prediction effect of A4, A5 and A6 directions
| ||||||||||||||||||||||||||||||||||||||||||||||||||||||||||||||||||||||||||||||||||||||||||||||
Table 5. Prediction effects of local model and global model on A1, A2 and A3 direction validation sets
| ||||||||||||||||||||||||||||||||||||||||||||||||||||||||||||||||||||||||||||||||||||||||||||||
Table 6. Prediction effects of local model and global model on A4, A5 and A6 direction validation sets

Set citation alerts for the article
Please enter your email address
© Copyright 2018-2021 | Chinese Laser Press. All Rights Reserved 沪ICP备15018463号-20