• Photonics Research
  • Vol. 9, Issue 3, B57 (2021)
Kangning Zhang, Junjie Hu, and Weijian Yang*
Author Affiliations
  • Department of Electrical and Computer Engineering, University of California, Davis, California 95616, USA
  • show less
    DOI: 10.1364/PRJ.410556 Cite this Article Set citation alerts
    Kangning Zhang, Junjie Hu, Weijian Yang. Deep compressed imaging via optimized pattern scanning[J]. Photonics Research, 2021, 9(3): B57 Copy Citation Text show less
    Landscape of imaging methods using a single-pixel detector. (a) Point scanning system where the signal from an individual pixel is sequentially recorded. (b) A conventional single-pixel camera where different patterns are sequentially projected on the entire object, and the overlap integrals between the object and each pattern are measured. (c) Deep compressed imaging via optimized pattern scanning (DeCIOPS), where a pattern is scanned across the object, and the subsampled convolution between the pattern and the object is measured.
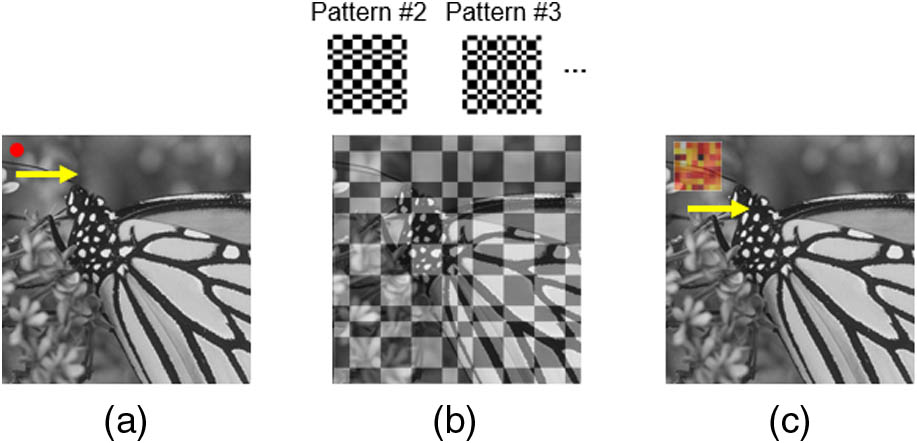
    Fig. 1. Landscape of imaging methods using a single-pixel detector. (a) Point scanning system where the signal from an individual pixel is sequentially recorded. (b) A conventional single-pixel camera where different patterns are sequentially projected on the entire object, and the overlap integrals between the object and each pattern are measured. (c) Deep compressed imaging via optimized pattern scanning (DeCIOPS), where a pattern is scanned across the object, and the subsampled convolution between the pattern and the object is measured.
    Schematic of the undersampling schemes in DeCIOPS. (a) Conventional pixel-by-pixel point scanning. (b) Pixel-by-pixel point scanning with a simple undersampling scheme. (c) DeCIOPS in a CW light source configuration with an illumination pattern of a uniform mask (left) or an optimized mask (right). (d) DeCIOPS in a low-repetition-rate pulsed light source configuration with a uniform mask (left) or an optimized mask (right) as an illumination pattern. The mathematic formula below each panel illustrates the process of image formation, where g1 and g2 are both square shaped.
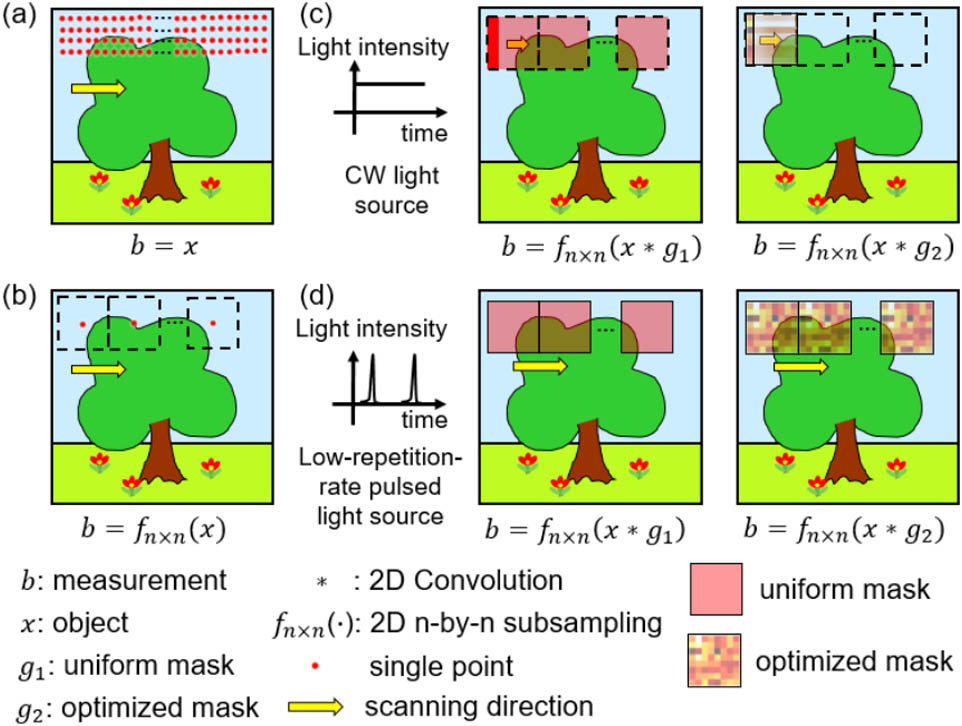
    Fig. 2. Schematic of the undersampling schemes in DeCIOPS. (a) Conventional pixel-by-pixel point scanning. (b) Pixel-by-pixel point scanning with a simple undersampling scheme. (c) DeCIOPS in a CW light source configuration with an illumination pattern of a uniform mask (left) or an optimized mask (right). (d) DeCIOPS in a low-repetition-rate pulsed light source configuration with a uniform mask (left) or an optimized mask (right) as an illumination pattern. The mathematic formula below each panel illustrates the process of image formation, where g1 and g2 are both square shaped.
    End-to-end optimized auto-encoder framework of image formation and reconstruction in DeCIOPS. The encoder models the image formation. It encodes the high-resolution (HR) object x into a low-resolution (LR) output b+ through subsampled convolution Φ and additive noise. The decoder is implemented with an ISTA-Net, which contains N phases and reconstructs the object x(N). Each phase is realized by a structure-symmetric pair of a forward transform F(k) and a backward transform F−1(k) with a soft shrinkage threshold, which factually matches one iteration in the conventional ISTA. ReLU, rectified linear unit; Soft(·), soft shrinkage threshold.
    Fig. 3. End-to-end optimized auto-encoder framework of image formation and reconstruction in DeCIOPS. The encoder models the image formation. It encodes the high-resolution (HR) object x into a low-resolution (LR) output b+ through subsampled convolution Φ and additive noise. The decoder is implemented with an ISTA-Net, which contains N phases and reconstructs the object x(N). Each phase is realized by a structure-symmetric pair of a forward transform F(k) and a backward transform F1(k) with a soft shrinkage threshold, which factually matches one iteration in the conventional ISTA. ReLU, rectified linear unit; Soft(·), soft shrinkage threshold.
    Comparison of the reconstruction performance in the validation data set Set11 and BSD68, at an undersampling rate of 6.25%, through (a) a simple dropout, (b) an unweighted average (uniform pattern), (c) a random or an optimized illumination pattern (DeCIOPS) with a constraint of identical column, and (d) a random or an optimized illumination pattern (DeCIOPS). The PSNR and resolution of the reconstructed images are labeled below the exemplary sample. (e) PSNR of the reconstructed images of all 79 samples in the validation dataset for cases in (a)–(d). (f) Resolution of the reconstructed images of all 79 samples in the validation dataset for cases in (a)–(d). n.s., not significant; *, p<0.05; **, p<0.01; ***, p<0.001; ****, p<0.0001, in one-way analysis of variance (ANOVA).
    Fig. 4. Comparison of the reconstruction performance in the validation data set Set11 and BSD68, at an undersampling rate of 6.25%, through (a) a simple dropout, (b) an unweighted average (uniform pattern), (c) a random or an optimized illumination pattern (DeCIOPS) with a constraint of identical column, and (d) a random or an optimized illumination pattern (DeCIOPS). The PSNR and resolution of the reconstructed images are labeled below the exemplary sample. (e) PSNR of the reconstructed images of all 79 samples in the validation dataset for cases in (a)–(d). (f) Resolution of the reconstructed images of all 79 samples in the validation dataset for cases in (a)–(d). n.s., not significant; *, p<0.05; **, p<0.01; ***, p<0.001; ****, p<0.0001, in one-way analysis of variance (ANOVA).
    Experiment setup of DeCIOPS. The laser beam is spatially filtered to improve its spatial uniformity and symmetricity, collimated and expanded in size, and then incident onto a DMD. The beam is spatially modulated by the DMD and then shrunk in size by a 4f system formed by a tube lens and an objective lens. The light pattern is scanned by a resonant-galvo scanner set, where a resonant scanner and a galvanometer mirror are optically coupled through a relay lens set. The transmitted light from the sample is collected by a photodetector through a collection lens. The n×n pattern is generated by the DMD. With an additional 4f system with cylindrical lenses after the objective lens, the n×n pattern can be turned into n×1 size (Appendix A.1). The red dashed line (plane 1 and object plane) indicates the conjugate plane of the gray-scale pattern mask.
    Fig. 5. Experiment setup of DeCIOPS. The laser beam is spatially filtered to improve its spatial uniformity and symmetricity, collimated and expanded in size, and then incident onto a DMD. The beam is spatially modulated by the DMD and then shrunk in size by a 4f system formed by a tube lens and an objective lens. The light pattern is scanned by a resonant-galvo scanner set, where a resonant scanner and a galvanometer mirror are optically coupled through a relay lens set. The transmitted light from the sample is collected by a photodetector through a collection lens. The n×n pattern is generated by the DMD. With an additional 4f system with cylindrical lenses after the objective lens, the n×n pattern can be turned into n×1 size (Appendix A.1). The red dashed line (plane 1 and object plane) indicates the conjugate plane of the gray-scale pattern mask.
    Comparison of the experimental results using different illumination patterns in the scanning in a CW illumination setting. (a)–(d) Experimental results of the sample: (a) butterfly, (b) cameraman, (c) house, and (d) the Flintstones. The different columns show the ground truth results using high-resolution point scanning, raw measurement using different illumination patterns at an undersampling rate of 6.25%, and the corresponding reconstruction results. (e) PSNR of the reconstructed images for a total of nine samples. (f) Spatial resolution of the reconstructed images for a total of nine samples, calculated from Fourier ring correlation. *, p<0.05; **, p<0.01; ***, p<0.001; ****, p<0.0001, in one-way ANOVA.
    Fig. 6. Comparison of the experimental results using different illumination patterns in the scanning in a CW illumination setting. (a)–(d) Experimental results of the sample: (a) butterfly, (b) cameraman, (c) house, and (d) the Flintstones. The different columns show the ground truth results using high-resolution point scanning, raw measurement using different illumination patterns at an undersampling rate of 6.25%, and the corresponding reconstruction results. (e) PSNR of the reconstructed images for a total of nine samples. (f) Spatial resolution of the reconstructed images for a total of nine samples, calculated from Fourier ring correlation. *, p<0.05; **, p<0.01; ***, p<0.001; ****, p<0.0001, in one-way ANOVA.
    Comparison of the experimental results using different illumination patterns in the scanning in the low-repetition-rate pulsed light illumination setting. (a)–(d) Experimental results of the sample: (a) butterfly, (b) cameraman, (c) house, and (d) the Flintstones. The different columns show the ground truth results using high-resolution point scanning, raw measurement using different illumination patterns at an undersampling rate of 6.25%, and the corresponding reconstruction results. (e) PSNR of the reconstructed images for a total of nine samples. (f) Spatial resolution of the reconstructed images for a total of nine samples, calculated from Fourier ring correlation. *, p<0.05; **, p<0.01; ***, p<0.001; ****, p<0.0001, in one-way ANOVA.
    Fig. 7. Comparison of the experimental results using different illumination patterns in the scanning in the low-repetition-rate pulsed light illumination setting. (a)–(d) Experimental results of the sample: (a) butterfly, (b) cameraman, (c) house, and (d) the Flintstones. The different columns show the ground truth results using high-resolution point scanning, raw measurement using different illumination patterns at an undersampling rate of 6.25%, and the corresponding reconstruction results. (e) PSNR of the reconstructed images for a total of nine samples. (f) Spatial resolution of the reconstructed images for a total of nine samples, calculated from Fourier ring correlation. *, p<0.05; **, p<0.01; ***, p<0.001; ****, p<0.0001, in one-way ANOVA.
    (a) PSNR and (b) pixel resolution of the reconstructed images versus different SNRs in the raw measurement, for three different sampling patterns (CW configuration), performed through simulation at an undersampling rate of 6.25%. The results were averaged across nine samples used in the experiment and fitted with polynomial curves. (c) and (d) show the experimental results averaged across nine samples.
    Fig. 8. (a) PSNR and (b) pixel resolution of the reconstructed images versus different SNRs in the raw measurement, for three different sampling patterns (CW configuration), performed through simulation at an undersampling rate of 6.25%. The results were averaged across nine samples used in the experiment and fitted with polynomial curves. (c) and (d) show the experimental results averaged across nine samples.
    DeCIOPS reconstruction quality (a) PSNR and (b) pixel resolution dependence on the size of the optimized pattern, for an undersampling rate of 25% (2×2, red), 11.1% (3×3, green), 6.25% (4×4, blue), and 1.5625% (8×8, black), across all 79 samples in the validation dataset. Solid curve, mean; shaded area, standard deviation.
    Fig. 9. DeCIOPS reconstruction quality (a) PSNR and (b) pixel resolution dependence on the size of the optimized pattern, for an undersampling rate of 25% (2×2, red), 11.1% (3×3, green), 6.25% (4×4, blue), and 1.5625% (8×8, black), across all 79 samples in the validation dataset. Solid curve, mean; shaded area, standard deviation.
    Comparison of the reconstruction results between DeCIOPS and conventional switching-mask-based single-pixel camera. (a) The ground truth of an original object, butterfly. (b) Reconstruction result of DeCIOPS using ISTA-Net at an undersampling rate of 6.25%. (c) Reconstruction result of the switching-mask-based single-pixel camera imaging approach using ISTA-Net. Top row, simulation. Bottom row, experiment. The ground truth of the experiment is obtained by the high-resolution point scanning.
    Fig. 10. Comparison of the reconstruction results between DeCIOPS and conventional switching-mask-based single-pixel camera. (a) The ground truth of an original object, butterfly. (b) Reconstruction result of DeCIOPS using ISTA-Net at an undersampling rate of 6.25%. (c) Reconstruction result of the switching-mask-based single-pixel camera imaging approach using ISTA-Net. Top row, simulation. Bottom row, experiment. The ground truth of the experiment is obtained by the high-resolution point scanning.
    Experimental setup of DeCIOPS that generates an n×1 size pattern and scans it across the sample. The setup is similar to that generating the n×n size pattern shown in Fig. 5, but with a 4f system composed of cylindrical lenses added after the objective lens to shrink the original n×n size pattern in one dimension by a factor of n into the n×1 size. The red dashed line (plane 1 and object plane) indicates the conjugate plane of the gray-scale pattern mask.
    Fig. 11. Experimental setup of DeCIOPS that generates an n×1 size pattern and scans it across the sample. The setup is similar to that generating the n×n size pattern shown in Fig. 5, but with a 4f system composed of cylindrical lenses added after the objective lens to shrink the original n×n size pattern in one dimension by a factor of n into the n×1 size. The red dashed line (plane 1 and object plane) indicates the conjugate plane of the gray-scale pattern mask.
    (a) Measured patterns on the sample (super-pixels) match well with the designed patterns. Each gray-scale super-pixel is generated by 32×32 binary pixels in the DMD. The left panel shows the cases for 4×4 patterns, and the right panel shows the cases for the 4×1 pattern. (b) A single spot pattern is generated for conventional point-scanning imaging to obtain the high-resolution ground truth of the sample. The spot size matches the size of a super-pixel. (c) Pixel-by-pixel comparisons between the measured patterns on the sample and the designed patterns show excellent matchings between the two.
    Fig. 12. (a) Measured patterns on the sample (super-pixels) match well with the designed patterns. Each gray-scale super-pixel is generated by 32×32 binary pixels in the DMD. The left panel shows the cases for 4×4 patterns, and the right panel shows the cases for the 4×1 pattern. (b) A single spot pattern is generated for conventional point-scanning imaging to obtain the high-resolution ground truth of the sample. The spot size matches the size of a super-pixel. (c) Pixel-by-pixel comparisons between the measured patterns on the sample and the designed patterns show excellent matchings between the two.
    Measured patterns at the image plane stay consistent across different scanning angles.
    Fig. 13. Measured patterns at the image plane stay consistent across different scanning angles.
    Comparison of (a) PSNR and (b) pixel resolution of the reconstructed objects of all 79 samples in the validation dataset for B-spline, U-Net, DCSRN, and ISTA-Net in the auto-encoder framework, at an undersampling rate of 6.25%. n.s., not significant; **, p<0.01; ***, p<0.001; ****, p<0.0001, in one-way ANOVA.
    Fig. 14. Comparison of (a) PSNR and (b) pixel resolution of the reconstructed objects of all 79 samples in the validation dataset for B-spline, U-Net, DCSRN, and ISTA-Net in the auto-encoder framework, at an undersampling rate of 6.25%. n.s., not significant; **, p<0.01; ***, p<0.001; ****, p<0.0001, in one-way ANOVA.
    Optical setup of DeCIOPS with passive light illumination (i.e., structured detection) for applications such as photography.
    Fig. 15. Optical setup of DeCIOPS with passive light illumination (i.e., structured detection) for applications such as photography.
    Undersampling RatePSNR (dB)Normalized Resolution (pixel)
    Uniform PatternRandom PatternOptimized PatternUniform PatternRandom PatternOptimized Pattern
    6.25%21.49±1.8321.82±1.7223.13±1.542.79±0.18  2.68±0.16  2.55±0.15
    1.5625%15.91±2.0116.78±1.9418.47±1.754.55±0.264.28±0.253.76±0.21  
    Table 1. Comparison of the PSNR and Pixel Resolution across the Uniform Pattern, Random Pattern, and Optimized Pattern between 6.25% and 1.5625% Undersampling Rate in DeCIOPSa
    SimulationExperiment
    PSNR (dB)Normalized Resolution (pixel)PSNR (dB)Normalized Resolution (pixel)
    DeCIOPS28.01±1.032.13±0.1227.71±1.182.15±0.13
    Switching-mask-based single-pixel camera28.36±1.002.12±0.1227.98±1.162.14±0.13
    Table 2. Comparison of Reconstruction Results between DeCIOPS (CW Light Configuration) and Conventional Switching-Mask-Based Single-Pixel Cameraa,b
    Kangning Zhang, Junjie Hu, Weijian Yang. Deep compressed imaging via optimized pattern scanning[J]. Photonics Research, 2021, 9(3): B57
    Download Citation