• Photonics Research
  • Vol. 6, Issue 1, 18 (2018)
Ying Zhang1, Yuehong Xu1, Chunxiu Tian2, Quan Xu1、2, Xueqian Zhang1, Yanfeng Li1, Xixiang Zhang2, Jiaguang Han1、*, and Weili Zhang1、3、4
Author Affiliations
  • 1Center for Terahertz Waves and College of Precision Instrument and Optoelectronics Engineering, Tianjin University, and the Key Laboratory of Optoelectronics Information and Technology Tianjin, Ministry of Education of China, Tianjin 300072, China
  • 2Physical Science and Engineering Division, King Abdullah University of Science and Technology, Thuwal 23955-6900, Saudi Arabia
  • 3School of Electrical and Computer Engineering, Oklahoma State University, Stillwater, Oklahoma 74078, USA
  • 4e-mail: weili.zhang@okstate.edu
  • show less
    DOI: 10.1364/PRJ.6.000018 Cite this Article Set citation alerts
    Ying Zhang, Yuehong Xu, Chunxiu Tian, Quan Xu, Xueqian Zhang, Yanfeng Li, Xixiang Zhang, Jiaguang Han, Weili Zhang. Terahertz spoof surface-plasmon-polariton subwavelength waveguide[J]. Photonics Research, 2018, 6(1): 18 Copy Citation Text show less
    (a) Illustration of the experimental setup. The inset shows a schematic of the waveguide structure with the following geometrical parameters: the period p, the width w, the length l, and the depth h of the pillar. (b) Dispersion relation of the SPP mode for one row (red line) of metal pillars. The inset is the normalized field magnitude of the electric field component (Ez) for the yz cross section of a single-row waveguide at 0.63 THz. The dashed line indicates the boundary between metal and air.
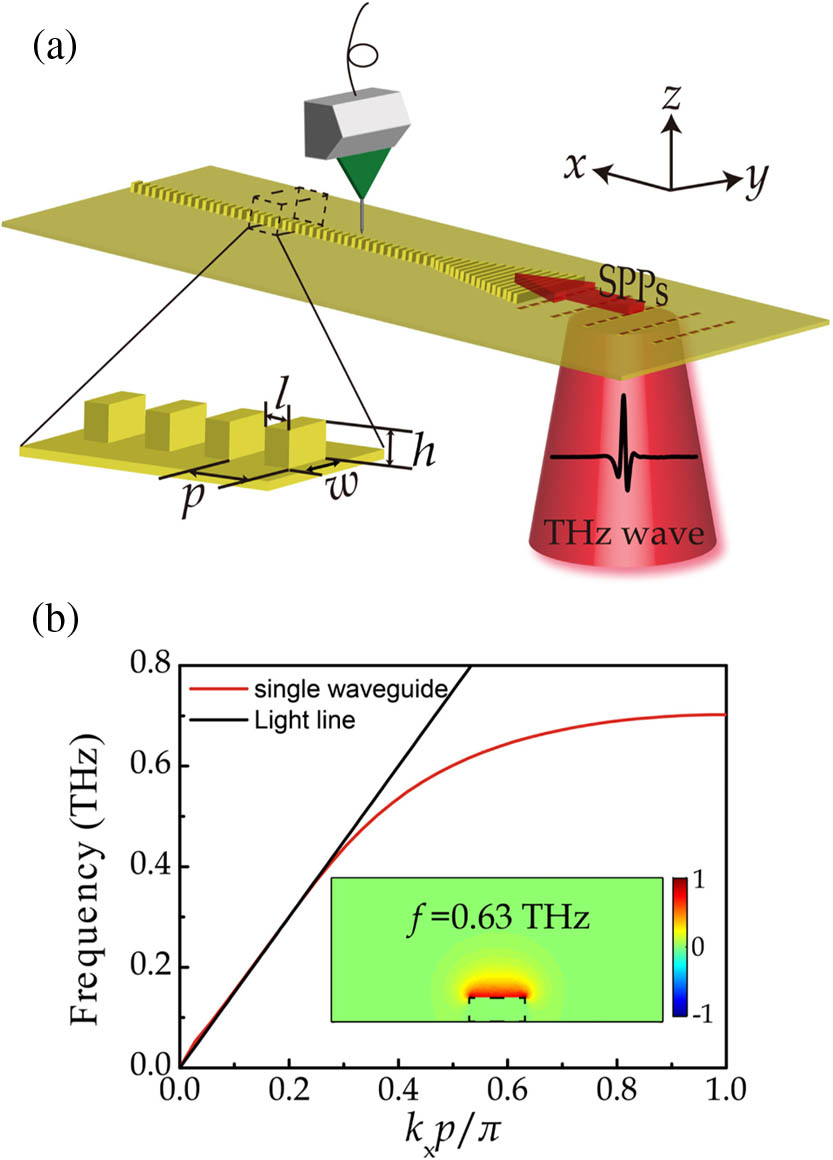
    Fig. 1. (a) Illustration of the experimental setup. The inset shows a schematic of the waveguide structure with the following geometrical parameters: the period p, the width w, the length l, and the depth h of the pillar. (b) Dispersion relation of the SPP mode for one row (red line) of metal pillars. The inset is the normalized field magnitude of the electric field component (Ez) for the yz cross section of a single-row waveguide at 0.63 THz. The dashed line indicates the boundary between metal and air.
    (a) SEM image of the straight waveguide. (b) Near-field image of the straight waveguide. The normalized power |Ez|2 distribution at 0.58 THz is shown. (c) Amplitude attenuation as a function of propagation distance. Blue dots represent experimental results, and the solid line is the exponential fit. (d) Measured electric field amplitude along the line x=3 mm, showing the horizontal confinement. (e) Amplitude as a function of increasing z. The red dots are experimental results, and the solid line is the exponential fit.
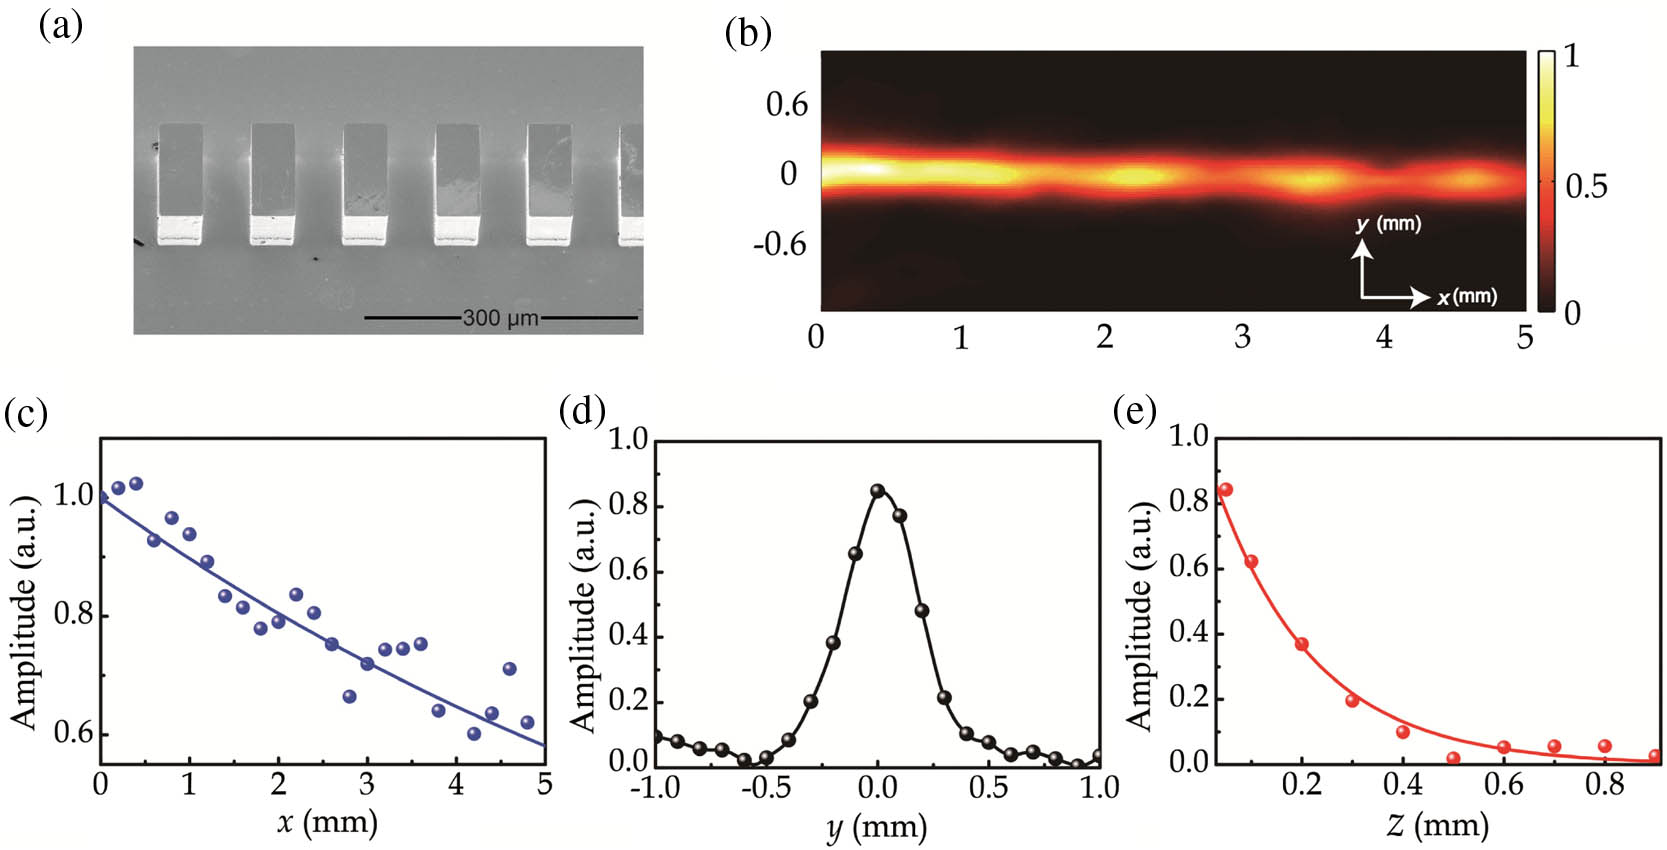
    Fig. 2. (a) SEM image of the straight waveguide. (b) Near-field image of the straight waveguide. The normalized power |Ez|2 distribution at 0.58 THz is shown. (c) Amplitude attenuation as a function of propagation distance. Blue dots represent experimental results, and the solid line is the exponential fit. (d) Measured electric field amplitude along the line x=3  mm, showing the horizontal confinement. (e) Amplitude as a function of increasing z. The red dots are experimental results, and the solid line is the exponential fit.
    (a) Schematic of S-bend and Y-splitter waveguides. Near-field images corresponding to (b) S-bend and (c) Y-splitter waveguides. The normalized power |Ez|2 distribution at 0.58 THz is shown. (d) Measured amplitude of the electric field as a function of the y coordinate along the lines x=0 mm (input) and x=3 mm (output) of the Y-splitter.
    Fig. 3. (a) Schematic of S-bend and Y-splitter waveguides. Near-field images corresponding to (b) S-bend and (c) Y-splitter waveguides. The normalized power |Ez|2 distribution at 0.58 THz is shown. (d) Measured amplitude of the electric field as a function of the y coordinate along the lines x=0  mm (input) and x=3  mm (output) of the Y-splitter.
    (a) Schematic of the DC with relevant parameters. (b) Normalized electric component (Ez) distribution for the yz cross section of even (upper) and odd modes (lower) supported by two parallel waveguides. (c) Dispersion relation of even and odd modes for DCs with varying g. (d) Calculated coupling length for DCs with different g values of 115, 90, 70, and 50 μm.
    Fig. 4. (a) Schematic of the DC with relevant parameters. (b) Normalized electric component (Ez) distribution for the yz cross section of even (upper) and odd modes (lower) supported by two parallel waveguides. (c) Dispersion relation of even and odd modes for DCs with varying g. (d) Calculated coupling length for DCs with different g values of 115, 90, 70, and 50 μm.
    (a)–(d) Normalized power distributions for DCs at 0.6 THz. (e)–(h) Field amplitudes of cross sections at the input (line x=0 mm) and end of straight waveguides (line x=2.8 mm) corresponding to DCs with g=115, 90, 70, and 50 μm from left to right, respectively. Lines x=0 mm and x=2.8 mm are represented as dotted lines in (a)–(d).
    Fig. 5. (a)–(d) Normalized power distributions for DCs at 0.6 THz. (e)–(h) Field amplitudes of cross sections at the input (line x=0  mm) and end of straight waveguides (line x=2.8  mm) corresponding to DCs with g=115, 90, 70, and 50 μm from left to right, respectively. Lines x=0  mm and x=2.8  mm are represented as dotted lines in (a)–(d).
    Ying Zhang, Yuehong Xu, Chunxiu Tian, Quan Xu, Xueqian Zhang, Yanfeng Li, Xixiang Zhang, Jiaguang Han, Weili Zhang. Terahertz spoof surface-plasmon-polariton subwavelength waveguide[J]. Photonics Research, 2018, 6(1): 18
    Download Citation