• Photonics Research
  • Vol. 9, Issue 4, 574 (2021)
Zhiwei Guo1、2、*, Tengzhou Zhang1, Juan Song1, Haitao Jiang1, and Hong Chen1、3、*
Author Affiliations
  • 1MOE Key Laboratory of Advanced Micro-structured Materials, School of Physics Sciences and Engineering, Tongji University, Shanghai 200092, China
  • 2e-mail: 2014guozhiwei@tongji.edu.cn
  • 3e-mail: hongchen@tongji.edu.cn
  • show less
    DOI: 10.1364/PRJ.413873 Cite this Article Set citation alerts
    Zhiwei Guo, Tengzhou Zhang, Juan Song, Haitao Jiang, Hong Chen. Sensitivity of topological edge states in a non-Hermitian dimer chain[J]. Photonics Research, 2021, 9(4): 574 Copy Citation Text show less
    Composite resonator with tunable gain and loss designed in the current study. (a) Effective circuit model of the composite resonator, composed of a simple LC resonator, a negative resistance convertor (NIC) component, and a tunable resistor. (b) Details of the composite resonator, where the gold and blue structures indicate the top and bottom copper layers, respectively. Here, d1=46.2 mm, d2=48 mm, and w=1.12 mm; the thickness of the substrate is h=1.6 mm. The lumped circuit elements and vias are marked by the green rectangles and red dots, respectively. (c) Circuit model of the NIC component. The effective gain is tuned by the external direct current (DC) voltage source. (d) Schematic of the realization of the NIC component based on RF chokes and metal-oxide-semiconductor field-effect transistors (MOSFETs).
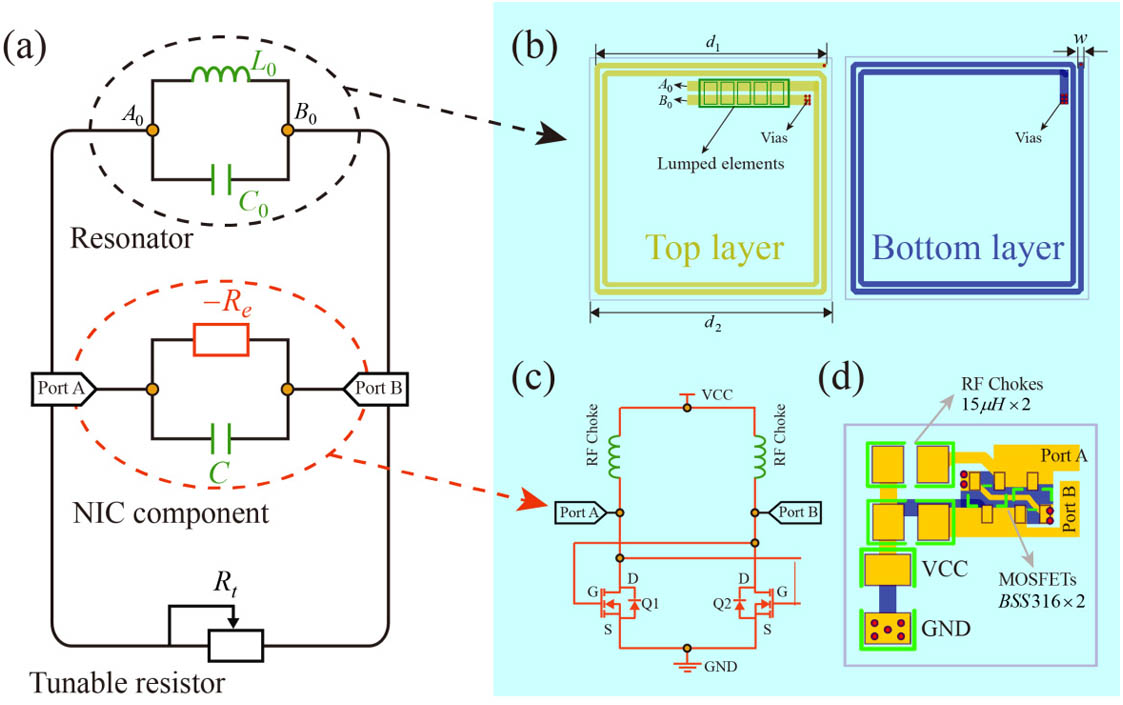
    Fig. 1. Composite resonator with tunable gain and loss designed in the current study. (a) Effective circuit model of the composite resonator, composed of a simple LC resonator, a negative resistance convertor (NIC) component, and a tunable resistor. (b) Details of the composite resonator, where the gold and blue structures indicate the top and bottom copper layers, respectively. Here, d1=46.2  mm, d2=48  mm, and w=1.12  mm; the thickness of the substrate is h=1.6  mm. The lumped circuit elements and vias are marked by the green rectangles and red dots, respectively. (c) Circuit model of the NIC component. The effective gain is tuned by the external direct current (DC) voltage source. (d) Schematic of the realization of the NIC component based on RF chokes and metal-oxide-semiconductor field-effect transistors (MOSFETs).
    Measured reflection spectrum of the composite resonator. (a) The reflection spectrum from changing the resistance without the external bias voltage. The resonant frequency, which is marked by the pink dashed line, is almost unchanged. (b) Similar to (a), but the external voltage changes while the resistance is fixed at R=2.8 kΩ. The slight frequency shift of 0.086 MHz is marked by gray shading.
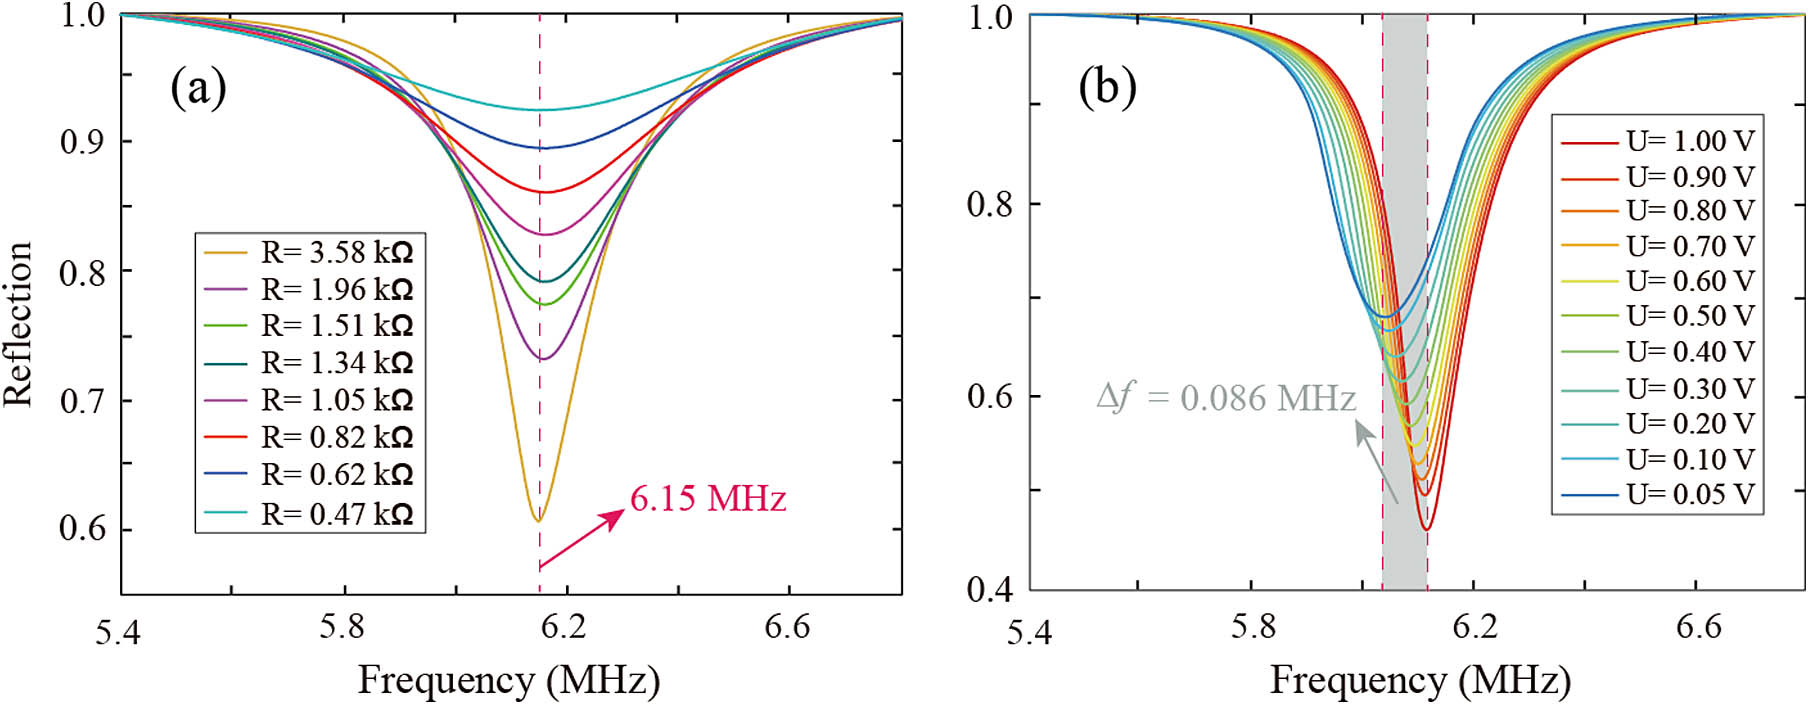
    Fig. 2. Measured reflection spectrum of the composite resonator. (a) The reflection spectrum from changing the resistance without the external bias voltage. The resonant frequency, which is marked by the pink dashed line, is almost unchanged. (b) Similar to (a), but the external voltage changes while the resistance is fixed at R=2.8  . The slight frequency shift of 0.086 MHz is marked by gray shading.
    1D non-Hermitian topological dimer chain. (a) Schematic of a topological dimer chain with 10 resonators. Effective loss and gain are added into the left and right resonators, respectively. (b) The real eigenfrequencies of the finite chain as a function of parameter gL. As gL increases, the splitting edge states gradually coalesce in the EP, which is marked by the black arrow. (c) The enlarged eigenfrequencies of two edge states as a function of parameter gL and frequency detuning ε. (d), (e) Normalized wave functions of two splitting edge states (ω+ and ω−).
    Fig. 3. 1D non-Hermitian topological dimer chain. (a) Schematic of a topological dimer chain with 10 resonators. Effective loss and gain are added into the left and right resonators, respectively. (b) The real eigenfrequencies of the finite chain as a function of parameter gL. As gL increases, the splitting edge states gradually coalesce in the EP, which is marked by the black arrow. (c) The enlarged eigenfrequencies of two edge states as a function of parameter gL and frequency detuning ε. (d), (e) Normalized wave functions of two splitting edge states (ω+ and ω).
    Measured reflection spectrum of the 1D non-Hermitian dimer chain. (a) Photo of the non-Hermitian topological dimer chain. The sample is put on a PMMA substrate with a thickness hs=1 cm. (b) Measured reflection spectrum as the dissipative loss of the lossy resonator, which is controlled by the tunable resistor at the right end of the chain, increases. Dots denote the frequencies of the edge states. Resistance is given on a logarithmic scale.
    Fig. 4. Measured reflection spectrum of the 1D non-Hermitian dimer chain. (a) Photo of the non-Hermitian topological dimer chain. The sample is put on a PMMA substrate with a thickness hs=1  cm. (b) Measured reflection spectrum as the dissipative loss of the lossy resonator, which is controlled by the tunable resistor at the right end of the chain, increases. Dots denote the frequencies of the edge states. Resistance is given on a logarithmic scale.
    Measured frequency splitting of edge states on frequency detuning of the right resonator, which is controlled by the loaded capacitors. The results are given on a logarithmic scale. The green circles, blue triangles, and pink stars indicate results from the EP, degenerating region, and splitting region, respectively. Green, pink, and blue dashed lines with slopes of 1/2, 1, and 1, respectively, are displayed for reference.
    Fig. 5. Measured frequency splitting of edge states on frequency detuning of the right resonator, which is controlled by the loaded capacitors. The results are given on a logarithmic scale. The green circles, blue triangles, and pink stars indicate results from the EP, degenerating region, and splitting region, respectively. Green, pink, and blue dashed lines with slopes of 1/2, 1, and 1, respectively, are displayed for reference.
    Frequency splitting as a function of disorder strength in the non-Hermitian dimer chain. The disorder is introduced by randomly moving four coil resonators 1.0, 1.5, 2.0, or 2.5 cm in the center of the chain. Each case is averaged by 20 realizations. Green, blue, and pink dashed lines indicate results from the EP, degenerating region, and splitting region, respectively. The standard deviation is represented by error bars.
    Fig. 6. Frequency splitting as a function of disorder strength in the non-Hermitian dimer chain. The disorder is introduced by randomly moving four coil resonators 1.0, 1.5, 2.0, or 2.5 cm in the center of the chain. Each case is averaged by 20 realizations. Green, blue, and pink dashed lines indicate results from the EP, degenerating region, and splitting region, respectively. The standard deviation is represented by error bars.
    Zhiwei Guo, Tengzhou Zhang, Juan Song, Haitao Jiang, Hong Chen. Sensitivity of topological edge states in a non-Hermitian dimer chain[J]. Photonics Research, 2021, 9(4): 574
    Download Citation