• Acta Optica Sinica
  • Vol. 38, Issue 6, 0606001 (2018)
Xiaomei Wang1、2, Chenfeng Yang1、2, Shixun Dai1、2、*, Yingying Wang1、2, Dong Xu1、2, and Chenyang You1、2
Author Affiliations
  • 1 Laboratory of Infrared Material and Devices, Advanced Technology Research Institute, Ningbo University, Ningbo, Zhejiang 315211, China
  • 2 Key Laboratory of Photoelectric Materials and Devices of Zhejiang Province, Ningbo, Zhejiang 315211, China
  • show less
    DOI: 10.3788/AOS201838.0606001 Cite this Article Set citation alerts
    Xiaomei Wang, Chenfeng Yang, Shixun Dai, Yingying Wang, Dong Xu, Chenyang You. Spectroscopic Analysis of Ethanol Solution Detection with Ge15Sb20Se65 Chalcogenide Glass Tapered Fiber[J]. Acta Optica Sinica, 2018, 38(6): 0606001 Copy Citation Text show less
    Principles of evanescent wave. (a) Normal fiber; (b) tapered fiber
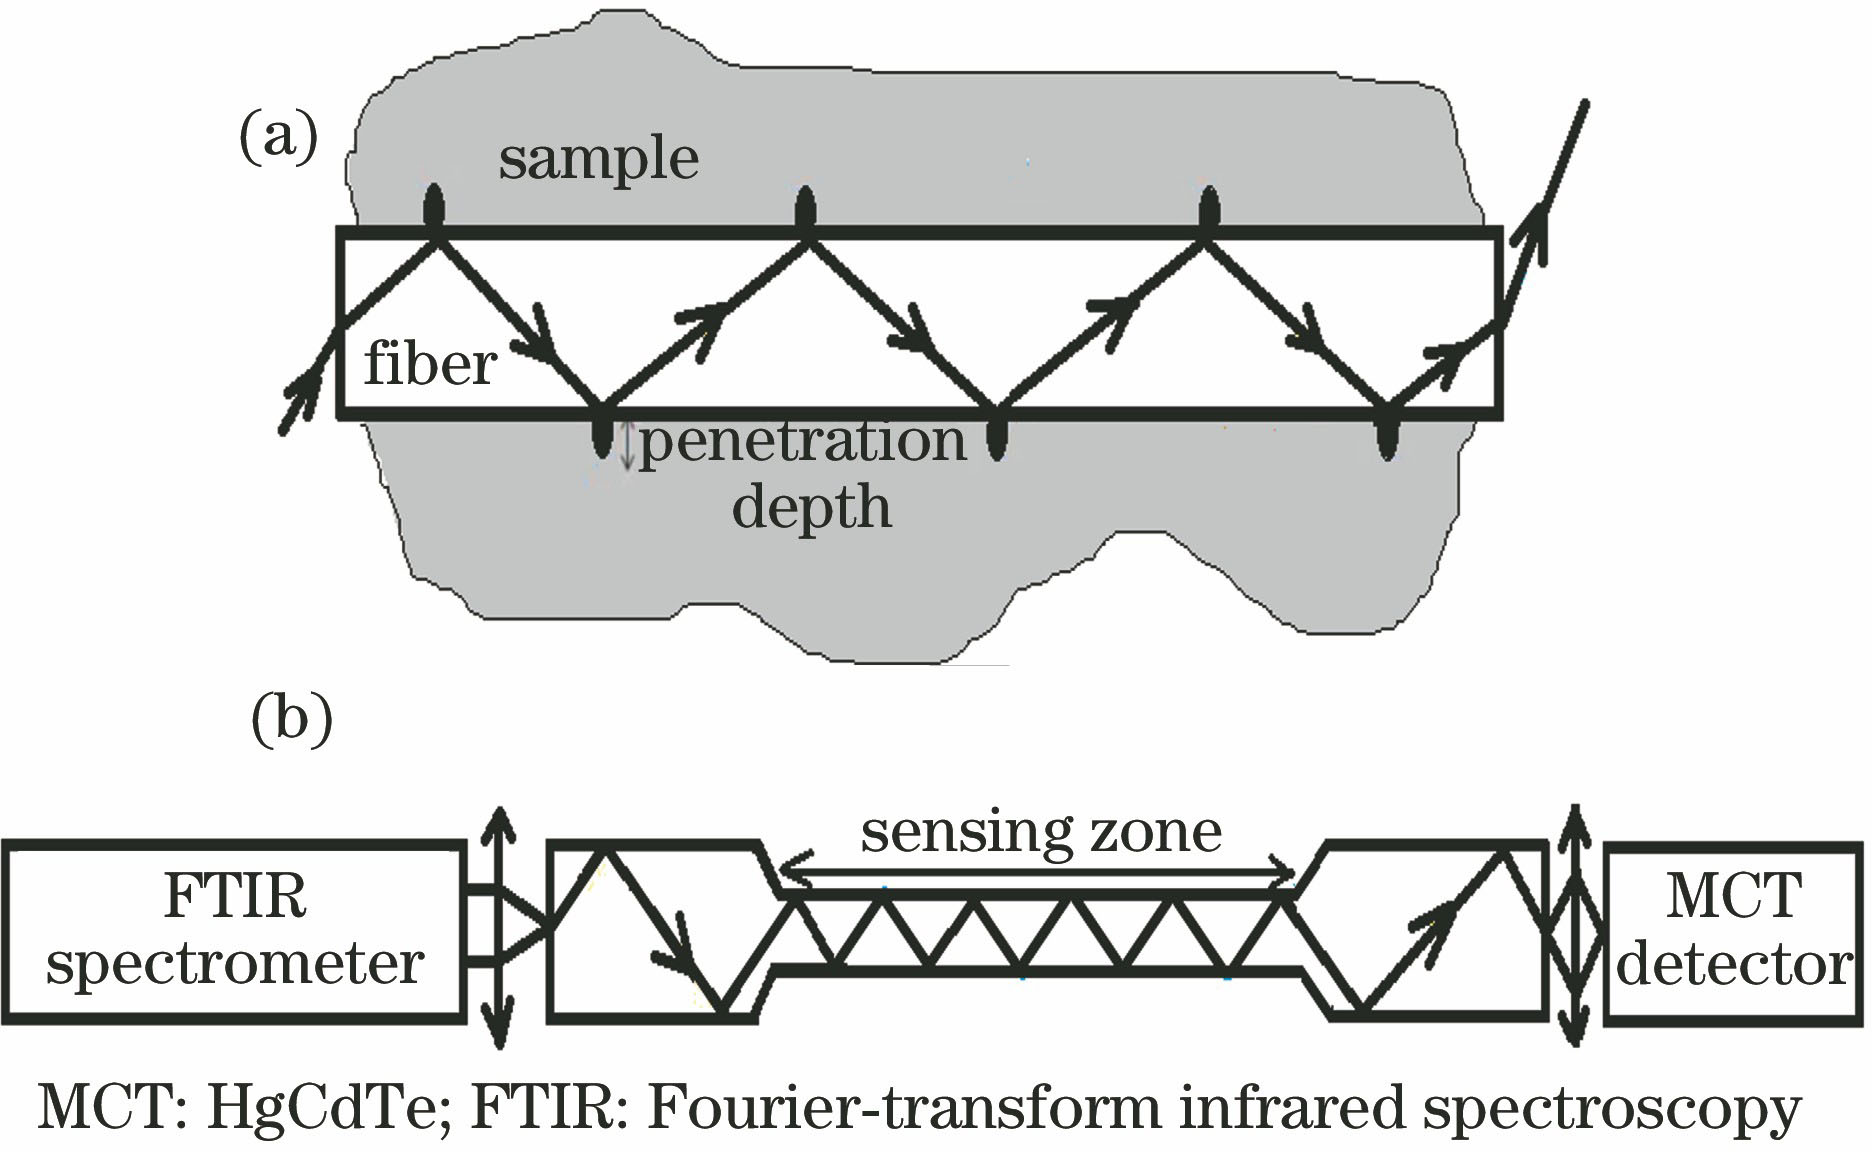
    Fig. 1. Principles of evanescent wave. (a) Normal fiber; (b) tapered fiber
    Experimental setup for ethanol solution detection with chalcogenide tapered fiber
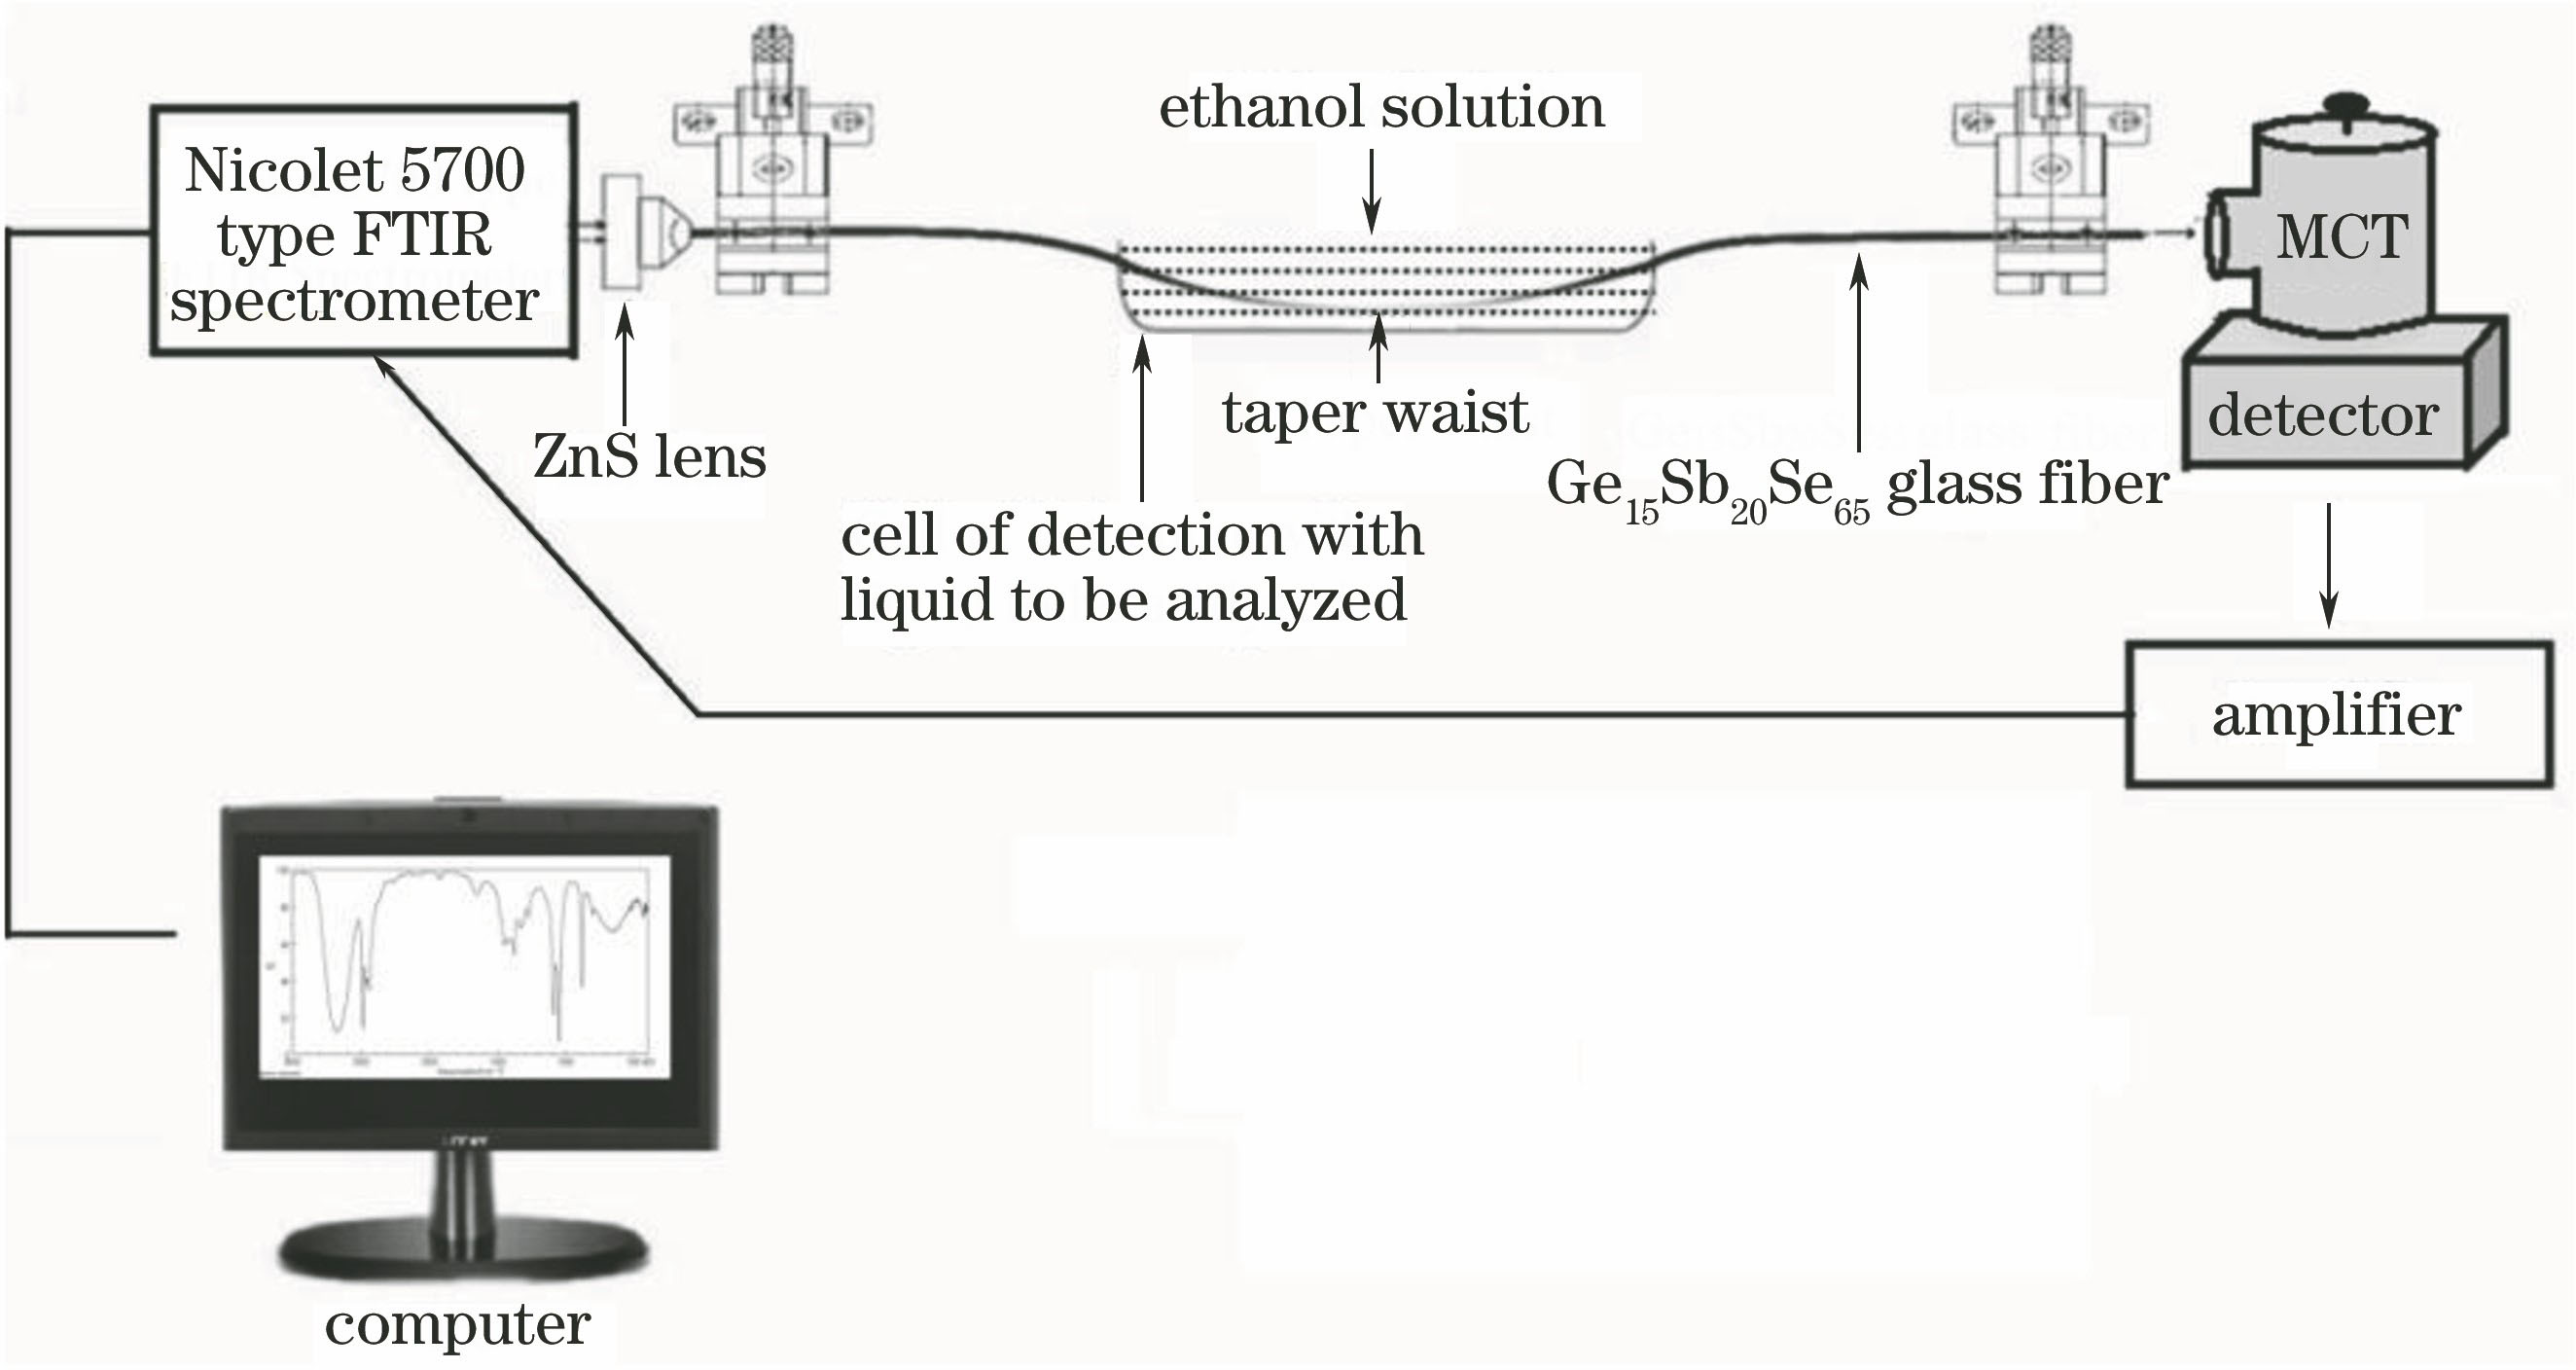
    Fig. 2. Experimental setup for ethanol solution detection with chalcogenide tapered fiber
    Infrared transmission spectrum of Ge15Sb20Se65 glass (thickness is 2 mm)
    Fig. 3. Infrared transmission spectrum of Ge15Sb20Se65 glass (thickness is 2 mm)
    Loss of Ge15Sb20Se65 bare glass fiber with a core diameter of 500 μm (The inset is an image of the cross-section of the fiber)
    Fig. 4. Loss of Ge15Sb20Se65 bare glass fiber with a core diameter of 500 μm (The inset is an image of the cross-section of the fiber)
    Surface images of Ge15Sb20Se65 tapered fiber-III. (a) Tapered transition; (b) taper waist
    Fig. 5. Surface images of Ge15Sb20Se65 tapered fiber-III. (a) Tapered transition; (b) taper waist
    IR spectra of bare fiber and tapered fibers for measuring ethanol solution with different volume fractions. (a) Untapered fiber; (b) tapered fiber I; (c) tapered fiber II; (d) tapered fiber III
    Fig. 6. IR spectra of bare fiber and tapered fibers for measuring ethanol solution with different volume fractions. (a) Untapered fiber; (b) tapered fiber I; (c) tapered fiber II; (d) tapered fiber III
    Relationship between absorbance and different volume fractions of ethanol solution at 9.53 μm with bare fiber and tapered fibers. (a) Untapered fiber; (b) tapered fiber I; (c) tapered fiber II; (d) tapered fiber III
    Fig. 7. Relationship between absorbance and different volume fractions of ethanol solution at 9.53 μm with bare fiber and tapered fibers. (a) Untapered fiber; (b) tapered fiber I; (c) tapered fiber II; (d) tapered fiber III
    Relationship between absorbance and low volume fraction of ethanol solution at 9.53 μm with tapered fiber III
    Fig. 8. Relationship between absorbance and low volume fraction of ethanol solution at 9.53 μm with tapered fiber III
    Simulation of relationship between light intensity of optical receiving end and different volume fraction of ethanol solution with the bare fiber and taper fibers
    Fig. 9. Simulation of relationship between light intensity of optical receiving end and different volume fraction of ethanol solution with the bare fiber and taper fibers
    Taper fiber typeCone length /cmCone waist diameter /μmTapered ratio
    I2.4271244.952∶1
    II4.0203110.445∶1
    III7.410920.2725∶1
    Table 1. Parameters of three Ge15Sb20Se65 taper fibers with different taper diameters
    Xiaomei Wang, Chenfeng Yang, Shixun Dai, Yingying Wang, Dong Xu, Chenyang You. Spectroscopic Analysis of Ethanol Solution Detection with Ge15Sb20Se65 Chalcogenide Glass Tapered Fiber[J]. Acta Optica Sinica, 2018, 38(6): 0606001
    Download Citation