• Matter and Radiation at Extremes
  • Vol. 5, Issue 6, 064401 (2020)
Yue Ma1、2、*, Jianfei Hua1, Dexiang Liu1, Yunxiao He1、2, Tianliang Zhang1, Jiucheng Chen1, Fan Yang1, Xiaonan Ning1, Zhongshan Yang1, Jie Zhang1、2, Chih-Hao Pai1, Yuqiu Gu2, and Wei Lu1
Author Affiliations
  • 1Department of Engineering Physics, Tsinghua University, Beijing 100084, China
  • 2Science and Technology on Plasma Physics Laboratory, Laser Fusion Research Center, China Academy of Engineering Physics, Mianyang, Sichuan 621900, China
  • show less
    DOI: 10.1063/5.0016034 Cite this Article
    Yue Ma, Jianfei Hua, Dexiang Liu, Yunxiao He, Tianliang Zhang, Jiucheng Chen, Fan Yang, Xiaonan Ning, Zhongshan Yang, Jie Zhang, Chih-Hao Pai, Yuqiu Gu, Wei Lu. Region-of-interest micro-focus computed tomography based on an all-optical inverse Compton scattering source[J]. Matter and Radiation at Extremes, 2020, 5(6): 064401 Copy Citation Text show less
    Schematic layout of experiment. The all-optical inverse Compton scattering source (AOCS) X-ray pulse (yellow) is generated by colliding a laser wakefield acceleration (LWFA) electron beam (blue) with the reflected laser pulse (red) using a plasma mirror. When x-ray photons hit the CsI(Tl) scintillation screen, visible light flashes (orange) are triggered and then captured by an electron-multiplying charge-coupled device.
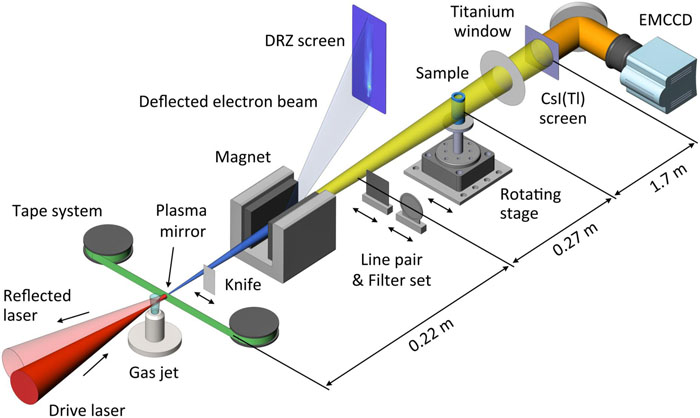
    Fig. 1. Schematic layout of experiment. The all-optical inverse Compton scattering source (AOCS) X-ray pulse (yellow) is generated by colliding a laser wakefield acceleration (LWFA) electron beam (blue) with the reflected laser pulse (red) using a plasma mirror. When x-ray photons hit the CsI(Tl) scintillation screen, visible light flashes (orange) are triggered and then captured by an electron-multiplying charge-coupled device.
    LWFA electron-beam characterization: (a) average spectrum of electron beams for 80 consecutive shots measured by an electron spectrometer based on a dipole magnet, where the blurred curve shows the FWHM error and the black dashed line shows the detection threshold; (b) average angular divergence of electron beams for 80 consecutive shots.
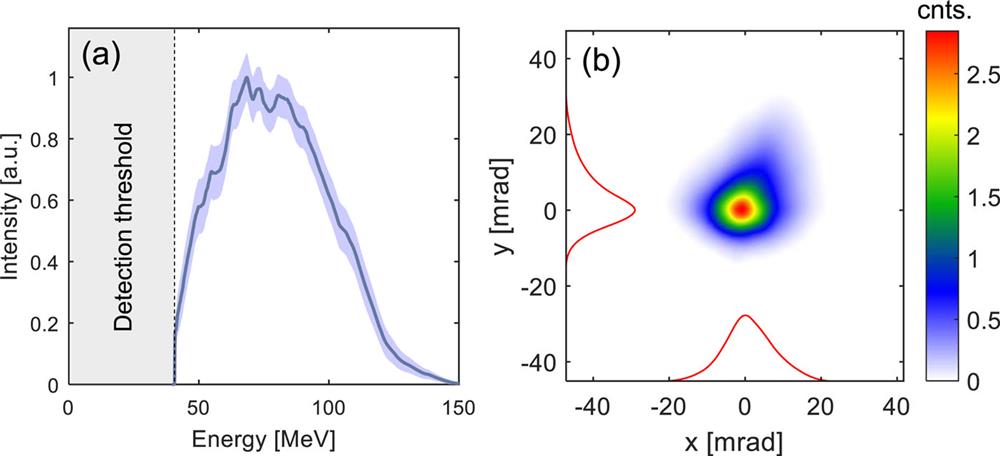
    Fig. 2. LWFA electron-beam characterization: (a) average spectrum of electron beams for 80 consecutive shots measured by an electron spectrometer based on a dipole magnet, where the blurred curve shows the FWHM error and the black dashed line shows the detection threshold; (b) average angular divergence of electron beams for 80 consecutive shots.
    AOCS characterization: (a) accumulated X-ray profile on detector for 50 consecutive shots; (b) X-ray intensity profile attenuated by multi-sector filter set (comprising seven aluminum plates of thickness 0.35 mm–8 mm and seven copper plates of thickness 0.35 mm–9 mm) for 50 consecutive shots; (c) on-axis X-ray spectrum deduced using the data in (b), where the blurred curve shows the error range and the inset shows the calculation error after each iteration. The single-shot source size (d) and the accumulated source size for 80 consecutive shots (e) are measured by the knife-edge technique, and the insets are the images of the sharp edge. (f) Accumulated projection image of a 10-lp/mm line pair for 80 consecutive shots and one of its line-outs, where a ∼20-µm defect within the black dashed square is identified clearly.
    Fig. 3. AOCS characterization: (a) accumulated X-ray profile on detector for 50 consecutive shots; (b) X-ray intensity profile attenuated by multi-sector filter set (comprising seven aluminum plates of thickness 0.35 mm–8 mm and seven copper plates of thickness 0.35 mm–9 mm) for 50 consecutive shots; (c) on-axis X-ray spectrum deduced using the data in (b), where the blurred curve shows the error range and the inset shows the calculation error after each iteration. The single-shot source size (d) and the accumulated source size for 80 consecutive shots (e) are measured by the knife-edge technique, and the insets are the images of the sharp edge. (f) Accumulated projection image of a 10-lp/mm line pair for 80 consecutive shots and one of its line-outs, where a ∼20-µm defect within the black dashed square is identified clearly.
    AOCS-based region-of-interest (ROI) micro-focus computed tomography (CT) imaging: (a) illustration of test object, with the ROI highlighted by a red dashed circle; (b) 60-shot accumulated projection image; (c) curve of modulation transfer function of tube edge marked by a black dashed line in the projection image (b); (d) three-dimensional reconstructed image within the ROI; (e) one slice of the tomographic image in (d). The ROIs in (b) and (e) are highlighted by a red dashed rectangle and circle, respectively.
    Fig. 4. AOCS-based region-of-interest (ROI) micro-focus computed tomography (CT) imaging: (a) illustration of test object, with the ROI highlighted by a red dashed circle; (b) 60-shot accumulated projection image; (c) curve of modulation transfer function of tube edge marked by a black dashed line in the projection image (b); (d) three-dimensional reconstructed image within the ROI; (e) one slice of the tomographic image in (d). The ROIs in (b) and (e) are highlighted by a red dashed rectangle and circle, respectively.
    Numerical simulation of AOCS-based ROI micro-focus CT for a turbine blade: (a) simulation layout—a turbine blade is placed in the x-ray path, with three sets of line pairs embedded in the ROI (within the red dashed circle); (b) photon energy and divergence distribution of AOCS (divergence within 5 mrad is used in the CT scanning); (c) reconstructed ROI of turbine blade; (d) line-outs of reconstructed line pairs with different noise levels (contrasts of the line pairs are labeled).
    Fig. 5. Numerical simulation of AOCS-based ROI micro-focus CT for a turbine blade: (a) simulation layout—a turbine blade is placed in the x-ray path, with three sets of line pairs embedded in the ROI (within the red dashed circle); (b) photon energy and divergence distribution of AOCS (divergence within 5 mrad is used in the CT scanning); (c) reconstructed ROI of turbine blade; (d) line-outs of reconstructed line pairs with different noise levels (contrasts of the line pairs are labeled).
    Yue Ma, Jianfei Hua, Dexiang Liu, Yunxiao He, Tianliang Zhang, Jiucheng Chen, Fan Yang, Xiaonan Ning, Zhongshan Yang, Jie Zhang, Chih-Hao Pai, Yuqiu Gu, Wei Lu. Region-of-interest micro-focus computed tomography based on an all-optical inverse Compton scattering source[J]. Matter and Radiation at Extremes, 2020, 5(6): 064401
    Download Citation