1Department of Engineering Physics, Tsinghua University, Beijing 100084, China
2Science and Technology on Plasma Physics Laboratory, Laser Fusion Research Center, China Academy of Engineering Physics, Mianyang, Sichuan 621900, China
Micro-focus computed tomography (CT), which allows the hyperfine structure within objects to be reconstructed, is a powerful nondestructive testing tool in many fields. However, current x-ray sources for micro-focus CT are typically limited by their relatively low photon energy and low flux. An all-optical inverse Compton scattering source (AOCS) based on laser wakefield acceleration can generate intense quasi-monoenergetic x/gamma-ray pulses in the kilo- to megaelectronvolt range with micrometer-level source size, and its potential application for micro-focus CT has become very attractive in recent years because of the rapid progress made in laser wakefield acceleration. Reported here is a successful experimental demonstration of high-fidelity micro-focus CT using an AOCS (~70 keV) by imaging and reconstructing a test object with complex inner structures. A region-of-interest CT method is adopted to utilize the relatively small field of view of the AOCS to ensure high spatial resolution. This demonstration of AOCS-based region-of-interest micro-focus CT is a key step toward its application in the field of hyperfine nondestructive testing.
I. INTRODUCTION
Inverse Compton scattering (ICS) based on colliding an energetic electron beam with an intense laser pulse can generate high-flux energy-tunable quasi-monoenergetic short x/gamma-ray pulses,1 with potential applications in biology, material science, and nuclear physics.2–9 ICS based on a conventional accelerator has been under development since the 1990s,10–12 but its further applications are quite limited because of its relatively large scale and cost. With the intensive development of laser wakefield acceleration (LWFA) in the past decade,13–16 electron beams with energies of hundreds of megaelectronvolts can be obtained easily within an acceleration distance of just a few millimeters using a table-top ultra-short high-power laser. By colliding this electron beam with another intense laser pulse or simply with the reflected laser pulse using a plasma mirror, energy-tunable (kilo- to megaelectronvolt level) high-flux (≳108 photons/pulse) ultra-short all-optical inverse Compton scattering source (AOCS) photon pulses are generated readily.9,17–25 The tiny spot size of the electron beam at the LWFA exit means that the AOCS source size is typically at micrometer level,18 which is especially preferable for high-resolution imaging applications such as micro-focus computed tomography (CT).4–6
To date, only AOCS-based projection imaging has been demonstrated.18,19 Herein, we report a successful AOCS-based micro-focus CT experiment by imaging and reconstructing a test object using a ∼70-keV AOCS driven by a 10-TW Ti:sapphire laser.26 An AOCS typically has a limited field of view because of its relatively small cone angle proportional to (where γ is the Lorenz factor of the electron beam),1 therefore a region-of-interest (ROI) CT scheme is adopted in the experiment. In this scheme, only the volume of interest within the sample (the fine inner structures of the test object) is scanned to obtain high-resolution reconstruction. Indeed, high-fidelity reconstruction algorithms for ROI CT have been developed successfully in the past decade,27–31 and these are especially advantageous for small-cone-angle scanning of refined inner structures within a large object.
II. EXPERIMENTS AND RESULTS
A. AOCS generation and characterization
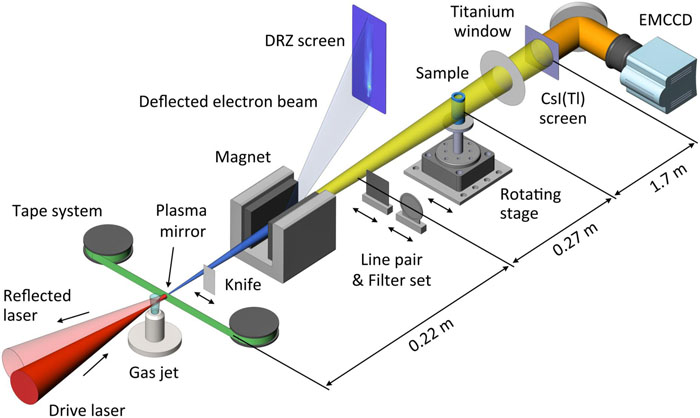
In the experiment, the AOCS x-ray pulses are generated with a scheme involving a plasma mirror,18 as shown in Fig. 1. The electron beams (∼76 MeV, ∼120 pC) are produced through LWFA by focusing the intense laser pulses (450 mJ, 40 fs) to a spot size of 9 µm (a0 ≈ 2) near the front edge of a 2-mm gas jet with mixed gases (99.5% He + 0.5% N2). In Fig. 2, the average energy spectrum and angular divergence of the electron beams for 80 consecutive shots are shown, with an average energy spread of 70% [full width at half maximum (FWHM)] and average divergences of 15 mrad and 12 mrad (horizontal and vertical, respectively). The drive laser pulse exiting the gas jet is reflected immediately by a plasma mirror formed when the laser hits a 100-µm polyethylene terephthalate (PET) tape mounted on an automatic stepping system. AOCS x-ray photons are then generated when the electron beam collides with the reflected laser pulse. To characterize the x-ray pulses, a detector comprising a CsI(Tl) scintillation screen (J8734; Hamamatsu Photonics, Japan), an optical transmission system, and an electron-multiplying charge-coupled device (DU888E; Andor Technology, UK) is adopted, which has an effective view of 4.3 × 4.3 cm2 with a spatial resolution of ∼50 µm. In Fig. 3(a), the x-ray intensity profile is shown, with an average photon yield of 3 × 10⁷ per shot and divergences of 33 mrad and 24 mrad (horizontal and vertical, respectively).
Figure 1.Schematic layout of experiment. The all-optical inverse Compton scattering source (AOCS) X-ray pulse (yellow) is generated by colliding a laser wakefield acceleration (LWFA) electron beam (blue) with the reflected laser pulse (red) using a plasma mirror. When x-ray photons hit the CsI(Tl) scintillation screen, visible light flashes (orange) are triggered and then captured by an electron-multiplying charge-coupled device.
Figure 2.LWFA electron-beam characterization: (a) average spectrum of electron beams for 80 consecutive shots measured by an electron spectrometer based on a dipole magnet, where the blurred curve shows the FWHM error and the black dashed line shows the detection threshold; (b) average angular divergence of electron beams for 80 consecutive shots.
Figure 3.AOCS characterization: (a) accumulated X-ray profile on detector for 50 consecutive shots; (b) X-ray intensity profile attenuated by multi-sector filter set (comprising seven aluminum plates of thickness 0.35 mm–8 mm and seven copper plates of thickness 0.35 mm–9 mm) for 50 consecutive shots; (c) on-axis X-ray spectrum deduced using the data in (b), where the blurred curve shows the error range and the inset shows the calculation error after each iteration. The single-shot source size (d) and the accumulated source size for 80 consecutive shots (e) are measured by the knife-edge technique, and the insets are the images of the sharp edge. (f) Accumulated projection image of a 10-lp/mm line pair for 80 consecutive shots and one of its line-outs, where a ∼20-µm defect within the black dashed square is identified clearly.
The x-ray intensity profile attenuated by a multi-sector filter set is measured to reconstruct the spectrum of the AOCS using an expectation-maximization algorithm,32 as shown in Figs. 3(b) and 3(c), and the measured on-axis x-ray spectrum has an average energy of ∼71 keV. For nearly head-to-head collision of the electron beams with the laser pulses in the experiment, the on-axis average energy of the AOCS x-ray photons can be described as ,1 where γ is measured experimentally to be ∼150, and ωr and ar are the angular frequency and the normalized vector potential, respectively, of the reflected laser pulse. To estimate the x-ray spectrum, ωr and ar are deduced from a three-dimensional particle-in-cell simulation with OSIRIS33 using parameters close to the experimental conditions. At the exit of the 2-mm plasma (density of 1.8 × 1019 cm−3), simulation gives red-shifted averages of ()34–36 and ar ≈ 1.3 (assuming a reflectivity of 90% by the plasma mirror), suggesting an on-axis average photon energy of ∼66 keV, in reasonable agreement with experimental measurements. The broad bandwidth of the spectrum in the experiment (∼122 keV) is caused mainly by the relatively wide energy spread (70%) of the electron beams and the enlarged bandwidth of the colliding laser induced by the red shift in the plasma.34–36 In future work, the AOCS bandwidth could be reduced by optimizing the LWFA electron beams and scattering laser pulses.
To characterize the AOCS source size, a knife-edge technique18 is used in the experiment. A 300-μm-thick copper plate with a sharp edge is inserted in the x-ray path 1.3 cm downstream of the AOCS, which gives a geometric magnification of ∼170 on the detector. In Fig. 3(d), a single-shot image of the sharp edge and its line-out are shown, together with three line-outs from numerical diffraction simulation of the sharp-edge with three different x-ray source sizes (zero, 1 μm, and 2 µm). Near the knife-edge portion, the experimental line-out matches the simulation line-out very well for the 1-µm source size, suggesting that the single-shot source size of the AOCS is ∼1 µm. Using the same method, the accumulated source size for 80 consecutive shots is measured to be ∼14 µm, as shown in Fig. 3(e). The enlargement of the source size is due mainly to the combined effect of the pointing jitters of the laser (∼4 µm) and the electron beam (∼10 µm caused by the injection process),32 and both can be reduced through optimization.
A sharp projection image of a 10-lp/mm line pair [Fig. 3(f)] is also taken with a geometric magnification of ∼10, which confirms that all three lines have a contrast of 70%. Furthermore, a ∼20-µm fine defect is also detected clearly with a contrast of 38%, suggesting that the imaging resolution should be better than 20 µm. Indeed, the spatial resolution R of the projection imaging is determined theoretically as37where a is the x-ray source size, d is the pixel size of the detector, and M is the geometric magnification. Thus the theoretically estimated imaging resolution is 13.6 µm, which agrees reasonably with the experimental measurement.
B. CT imaging and reconstruction
To demonstrate the AOCS-based ROI micro-focus CT, a test object [Figs. 4(a)] comprising a 1.5-mm-thick aluminum tube and a set of 130-μm-thick hollow copper pins of a LEMO connector is imaged. The ROI is chosen as the top portion of the pins (the hollow curved structures within the red dashed circle). The object is placed 0.49 m downstream of the AOCS, with a geometric magnification of 4.5 on the detector. In Fig. 4(b), a 60-shot accumulated projection image of the object is shown, where the ROI in the image is highlighted by a red dashed rectangle. The x-ray transmission rate within the ROI varies from 20% to 60% with a local signal-to-noise ratio of 10–17, sufficient for high-quality reconstruction.2 To estimate the imaging resolution, the modulation transfer function of a line-out across the aluminum tube edge [black dashed line in Fig. 4(b)] is plotted in Fig. 4(c), suggesting a ∼16 µm (∼31 lp/mm) resolution with 10% contrast, in good agreement with the theoretical estimation (15.6 µm) by Eq. (1).
Figure 4.AOCS-based region-of-interest (ROI) micro-focus computed tomography (CT) imaging: (a) illustration of test object, with the ROI highlighted by a red dashed circle; (b) 60-shot accumulated projection image; (c) curve of modulation transfer function of tube edge marked by a black dashed line in the projection image (b); (d) three-dimensional reconstructed image within the ROI; (e) one slice of the tomographic image in (d). The ROIs in (b) and (e) are highlighted by a red dashed rectangle and circle, respectively.
The CT scanning is then performed in 31 directions over 180°, with each projection obtained by 60-shot accumulation. The ROI of the object is reconstructed from only the corresponding portion of the projection images [within the red dashed rectangle in Fig. 4(b)] using a compressed-sensing-based algorithm.28–30 For CT imaging, the resolution of the reconstructed tomographic image is also related to the number of the projections according to the Nyquist sampling theorem,38 and the best CT imaging resolution (equal to that of each projection image) can be obtained by providing a sufficient number of projections.39,40 In principle, the compressed-sensing-based ROI CT algorithm has good tolerance to the local signal-to-noise ratio and enables accurate reconstruction using relatively few projections,41–43 thus 31 projections are indeed sufficient for a high-quality reconstruction in our case. A three-dimensional reconstruction of the ROI is shown in Fig. 4(d), and one slice of the tomographic image is shown in Fig. 4(e). The curved hollow structures of the copper pins are clearly evident in both images. In addition, the average attenuation coefficient of the copper pins can also be calculated to be 8.2 cm−1 from the reconstruction data, which suggests an average photon energy of ∼74 keV, which is consistent with the measured x-ray spectrum.
III. DISCUSSION
The AOCS can also generate high-energy (up to tens of megaelectronvolts) gamma-ray pulses with high flux and micrometer-level source size on a table top,23,44 and these features make it a unique source for micro-focus CT to image large objects made of dense materials. Current micro-focus CT powered by x-ray tubes typically has low-flux broadband photons with energies well below the megaelectronvolt level.8 Meanwhile, for the widely used megaelectronvolt bremsstrahlung gamma-ray source based on RF accelerators, the CT imaging resolution is quite limited because of its millimeter-level source size.45,46 Therefore, high-energy micro-focus CT based on an AOCS could be a very attractive solution for high-resolution imaging of dense objects such as turbine blades in aircraft engines (typically made of nickel-based alloy).47 Herein, a numerical CT simulation for such an object using AOCS-based gamma rays is performed with a MATLAB code to show the potential.
The layout of the simulation is shown schematically in Fig. 5(a), where a nickel-based turbine blade with three sets of line pairs (widths of 4.5 μm, 9 μm, and 18 µm) inside the ROI is located 0.8 m downstream of the AOCS, with a geometric magnification of 7.5 on the detector (pixel size of 30 µm). The AOCS adopted in the simulation is pre-generated using the Monte Carlo code CAIN,48 by colliding a 190-MeV electron beam (12% FWHM energy spread, 1 µm FWHM spot size) with a 0.6-J laser pulse (50-fs FWHM pulse duration, 40-µm waist radius). The obtained AOCS beam has a source size of 1 µm (FWHM) and an on-axis average energy of 0.7 MeV with 38% bandwidth, as shown in Fig. 5(b). The accumulated source size of the AOCS is assumed to be 4 µm by choosing a source position jitter of 3 µm.
Figure 5.Numerical simulation of AOCS-based ROI micro-focus CT for a turbine blade: (a) simulation layout—a turbine blade is placed in the x-ray path, with three sets of line pairs embedded in the ROI (within the red dashed circle); (b) photon energy and divergence distribution of AOCS (divergence within 5 mrad is used in the CT scanning); (c) reconstructed ROI of turbine blade; (d) line-outs of reconstructed line pairs with different noise levels (contrasts of the line pairs are labeled).
The ROI of the blade is scanned in 500 directions over 360° and then reconstructed using the same algorithm adopted in the aforementioned experiment. In Fig. 5(c), the reconstruction of the ROI is shown, where the fine features (three sets of line pairs) on the blade can be identified clearly. In Fig. 5(d), the line-outs of these three line pairs are also shown to have sufficiently good contrasts (96% for 18-µm width, 62% for 9-µm width, and 12% for 4.5-µm width), suggesting an imaging resolution of ∼4.5 µm. This challenging application is sensitive to the noise of the projections, thus reconstructions of the blade with different projection noise (0.5% and 1%) are performed, and the corresponding line-outs are also plotted in Fig. 5(d), indicating that a noise level below 0.5% is required to achieve a sub-10-µm resolution. The high photon flux of the AOCS means that such a level of projection noise can be obtained easily using a commercial x-ray detector.
IV. SUMMARY
To summarize, an experiment involving AOCS-based ROI micro-focus CT was carried out, proving its feasibility for high-resolution reconstruction of complex structures. A numerical simulation to image a dense object (turbine blade) was also performed, showing the AOCS’s potential application at high energy. With further improvements in source characteristics (source size, spectrum, and photon flux) and the detection system (collection efficiency and spatial resolution), compact AOCS-based ROI micro-focus CT may become an important new tool for hyperfine nondestructive testing in the near future. In addition, the micro-focus of the AOCS also enables a high spatial coherence, thus the phase effect will be significant because of Fresnel diffraction at lower photon energies (around kiloelectronvolts). Therefore, AOCS-based phase-contrast micro-CT will be another feasible means of biological study.
References
[1] L. A. Gizzi, L. Labate, P. Tomassini. Inverse Compton scattering x-ray sources. Handbook of X-Ray Imaging: Physics Technology, 309-323(2017).
[33] L. O. Silva, F. S. Tsung, R. A. Fonseca et al. OSIRIS: A three-dimensional, fully relativistic particle in cell code for modeling plasma based accelerators.
[42] X. Pan, C. M. Kao, E. Y. Sidky. Accurate image reconstruction from few-views and limited-angle data in divergent-beam CT. J. X-Ray Sci. Technol., 14, 119-139(2006).