
Ying HE, Yu-Jun ZHANG, Kun YOU, Bo-Qiang FAN, Meng-Qi LI, Dong-Qi YU, Hao XIE, Bo-En LEI, Wei JIA, Jun-Sen JING, Wen-Qing LIU. Precise measurements the broadening characteristics and parameters of methane near-infrared absorption spectrum at high pressure[J]. Journal of Infrared and Millimeter Waves, 2020, 39(6): 742
- Journal of Infrared and Millimeter Waves
- Vol. 39, Issue 6, 742 (2020)
Abstract
Keywords
Introduction
High-pressure gas detection is required urgently in the fields of natural gas pipeline transportation monitoring, deep submergence detection, aircraft engine diagnosis and other industries and national defense fields. Traditional semiconductor and electrochemical sensors which use contact measurement methods are prone to false alarm in high-pressure environment as the poor adaptability and difficult to meet on-line detection needs at high-pressure. In recent years, a new spectroscopy detection technology represented by Tunable Diode Laser Absorption Spectroscopy (TDLAS) technology has become a research focus in gases diagnosis under extreme conditions such as high temperature and high-pressure environment because of its high sensitivity, high selectivity, non-contact detection and strong adaptability to harsh environment [
In high-pressure environment, due to the molecular collision aggravation the absorption spectral line broadened obviously, which led to the change of characteristic absorption spectrum. So, the spectral characteristic parameters must be accurately obtained for inverting gas concentration. At present, the study of spectral characteristic parameters at normal pressure is comprehensive. For example, Rieker et al. [
As an important fuel and chemical raw material, methane has been widely used in civil and industrial fields. In this paper, the research experiment of spectrum broadening characteristics of methane at 6 046.96 cm-1 in high pressure environment was carried out with TDLAS technology. Then, the high-resolution absorption spectra at different high pressures were obtained to analyze the broadening characteristics and parameters. Finally, a concentration inversion algorithm at high-pressure was designed. The research will deepen the understanding of high-resolution absorption spectrum characteristics in high-pressure environment.
1 Measurement principle
Based on Lambert-Beer's law, a monochromatic laser with the emitting frequency of and the initial intensity of passes through an absorption medium of L in length, and the laser intensity at the receiving end is , so the absorbance used to represent the absorption intensity can be expressed as Eq.1:
where S(T) is the line strength, P is the pressure, x is the gas concentration, and is normalized linear function. As the spectral frequency of molecular absorption or molecular emission is not strictly monochromatic, the molecular absorption spectrum has linewidth and line-type [
Linewidth is proportional to pressure P at a certain temperature which expressed as Eq.2:
where xB is the mole fraction of collision gas, is the binary collision broadening coefficient between components B and A which is a function of temperature. Each collision pairs and specific radiation transition is corresponding to a broadening coefficient. Hitran database gives the collision broadening coefficient in the normal atmospheric environment including the self-broadening coefficient and the air broadening coefficient (at 296 K as the reference temperature, 1 atm as the reference pressure). The relationship between collision broadening coefficient and temperature T can be expressed as Eq.3:
where T0 is the reference temperature, is the broadening coefficient at T0, and n is the temperature dependent coefficient (usually < 1, typical value is 0.5).
The center frequency of the corresponding absorption line at different pressures is obtained by linear fitting of the absorbance curves, and the corresponding relation can be expressed as Eq.4:
where is the original center frequency, is the self-induced pressure shift coefficient, and is the nitrogen-induced pressure shift coefficient.
2 Experimental equipment
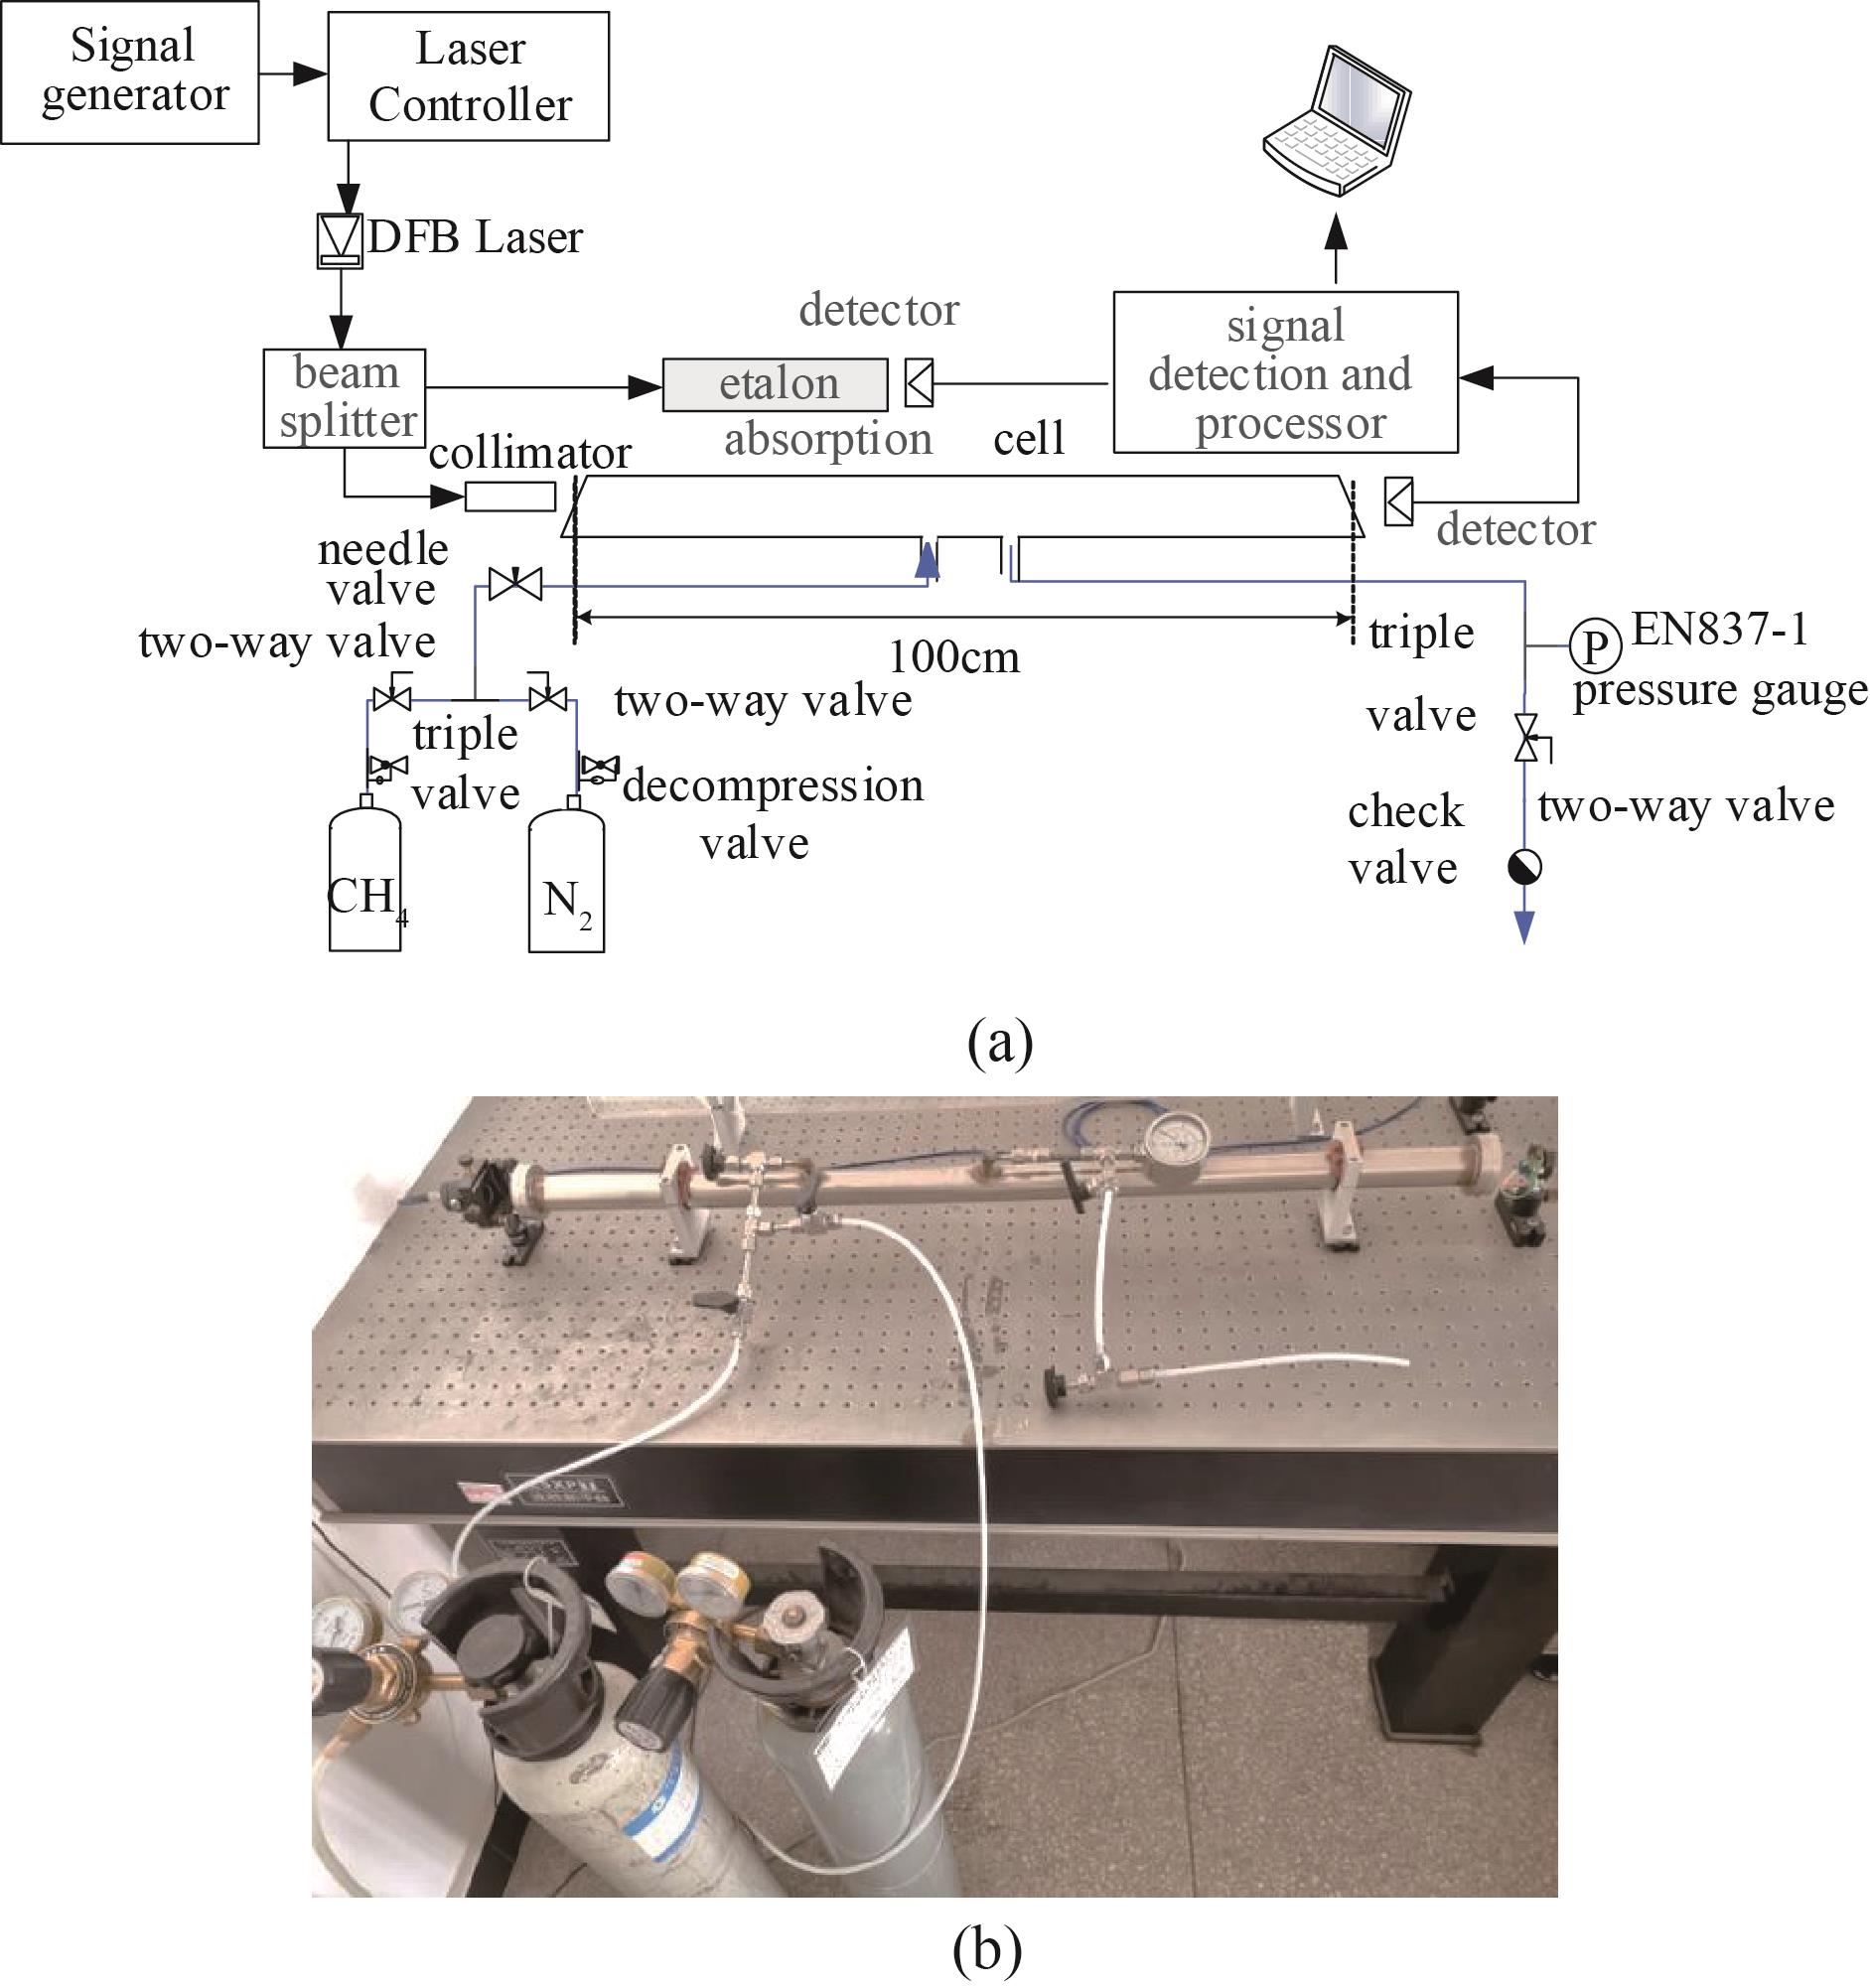
The high-pressure experimental platform for spectrum detection with TDLAS was built, as shown in Fig. 1. The laser was a commercial DFB laser (NLK1U5EAAA, NEL Corporation) with the typical center wavelength of 1 653.72 nm, the laser bandwidth of 2 MHz and the side-mode suppression ratio (SMSR) of 41.68 dB. The laser controller LDC-3724C drove and ensured the laser under stable operation, and the signal generator generated a saw-tooth signal as a wavelength scanning signal. The laser emitted and passed through a beam splitter divided the laser into two paths, wherein 98% of the laser was collimated through a stainless steel absorption cell for gas high-pressure spectrum measurement. The other 2% of the laser was collimated through an etalon for wavelength calibration and conversion from time domain to frequency domain, which was detected by a detector (GAP1000L, GPD Corporation) with the minimum noise equivalent power of 10 nW. The detection signal was transferred to a signal detection and processor for absorbance extraction and spectrum broadening characteristics analysis. The absorption cell was 100 cm in length with the pressure resistance range within 10 atm. Wedge-shaped quartz window plates are installed with a 3° inclination angle of the end face of the absorption cell to reduce the interference impact on spectrum measurement. A pressure gauge (EN837-1, Swagelok Corporation) is installed on the side wall to monitor the pressure value in whole measurement process.
![]()
Figure 1.(a) Spectrum measurement experimental platform, (b) gas path connection of experimental device
3 Experiment and analysis
In this experiment, the absorption line of methane molecule at 1653.7 nm in the overtone band 2ν3 was selected, and the specific parameters of methane absorption line were shown in Table 1. The typical laser linewidth is 2 MHz, and there are no strong absorption lines of interfering gases (such as water vapor, carbon dioxide, etc.) in the 0.5 nm range on both sides of the absorption line.
| spectral line intensity S(cm mol-1) | 1.34E-21 |
| air-broadened half width at half maximum | 0.062 1 |
| self-broadened half width at half maximum | 0.082 |
| temperature dependence coefficient of the air-broadened | 0.85 |
| pressure shift of the air-broadened δair@296 K/ (cm -1 atm -1) | 0 |
Table 1. Specific parameters of methane absorption line at 6046.9647 cm-1(Hitran2008 database)
3.1 Experimental steps
In the experiment, the temperature and current operating parameters of the laser controller were firstly tuned to the position of the goal absorption line, and a saw-tooth signal of 100 Hz was used with the wavelength scanning range of about 0.25 nm. It is necessary to maintain air tightness in the experiment. First, 99.99% nitrogen was introduced into the high-pressure absorption cell to remove any residual gas adsorbed, and then the above step was repeated three times with the lasting time of 2∼3 minutes. Subsequently, the methane standard gas (1.0% volume concentration mixed nitrogen) was transmitted into the high-pressure absorption cell, and the valve was closed after 2 minutes. The spectrum measurement was carried out after the gas fully stabilizing about 30 seconds, and the pressure data was synchronously observed by EN837-1 gauge. Thus, a group of methane measurement spectrum was obtained respectively at different pressures (1.5∼5 atm) for analyzing. The uncertainty of the standard gas used here was about 2.0% which produced by Nanjing Special Gas Corporation. The collected detection spectral signals can be converted from time domain to frequency domain by etalon signal (FSR = 3 GHz) collected synchronously.
3.2 Spectral measurement and analysis
(1)Spectrum analysis algorithm
When TDLAS technology was used to gas detection, the noise caused by electronic components, window deformation in high-pressure environment and other factors will affect the measurement accuracy. Therefore, according to the non-linear and non-stationary characteristics of spectral signals, the empirical mode decomposition algorithm was selected to filter the detected spectral signals according to the advantages and disadvantages of various de-noising algorithms. Then, the Lorentz line-type fitting algorithm was used to obtain the absorbance signal and extract the characteristic absorption spectrum. The spectral analysis algorithm was as follows [
(i)Firstly, all the extreme points in the specific signal X(t) were founded out, then, the upper envelope and the lower envelope were formed by cubic spline curve method with all of the extreme points. Supposing the average value of the upper and lower envelopes were m1, and the difference H1 can be expressed as Eq.5:
At the same time, H1 was regarded as a new X(t), and the above steps were repeated until H1 satisfying the two conditions of the eigenmode function IMF. Then H1 was defined as the first-order IMF, denoted as IMF1. In general, the highest frequency component of the original signal was located in IMF1.
(ii) Secondly, the IMF1 was separated from X(t) to obtain the difference signal r1 which was expressed as Eq.6:
where r1 was regarded as a new signal and the above steps were also repeated until the residual signal of the n order became a monotone function when the IMF variables which satisfied the eigenmode function cannot be generated. The residual signal of the n order was regarded as Eq.7:
Mathematically, X(t) can be expressed as the sum of IMF components and a residual function, i.e.:
where was the residual function representing the average trend which contained different frequencies components arranged from high to low.
(iii) Thirdly, the IMF of each order was separated by a preset threshold value to generate the de-noised IMF components which were accumulated together with the residual function and to realize the de-noised signal reconstruction.
(iv)The de-noised signal was subjected to background baseline fitting to extract the absorbance signal. In general, the signal de-noising effect is evaluated by the signal-to-noise ratio (SNR) or root- -mean-square error (RMSE) [
![]()
Figure 2.(a) Absorbance signal before and after filtering, (b) line-type fitting and residual result
(v)The Lorentz line-type function was used to fit absorbance spectral signal after time domain to frequency domain converting, and the fitting residual error was calculated within ±1%, as shown in Fig.2(b).
(2)Measurement of N2-CH4 mutual broadening coefficient
A group of spectral signals at different pressures were measured. The absorption linewidth showed obvious broadening characteristics that it increased with pressure increasing but the peak values of the signals decreased, so the line shape tended to be flat. The integrated absorbance spectral signals were shown in Fig. 3, in which the linewidth increased from 0.19 cm-1 at 1.5 atm to 0.62 cm-1 at 5 atm.
![]()
Figure 3.Absorbance spectral signals after Lorentz line-type fitting
The line-type change of gas absorption lines was mainly due to the gas molecule collision intensifying in high pressure environment which enhanced the collision broadening effect. The actual broadening coefficient of absorption line was obtained by calculating the slope of linear fitting of the line-width result at different pressures, as shown in Fig.4. The slope k(T) can be expressed as Eq.9:
![]()
Figure 4.Nitrogen broadening coefficient at 6 046.96 cm-1
In this experiment, the methane concentration was 1.0%, so the content of N2 molecules in unit volume was much larger than that of methane molecules. Therefore, self-broadening caused by collision between the same molecules can be ignored, only the nitrogen broadening of the collision between methane molecules in excited state and N2 molecules needed to be considered. The nitrogen broadening coefficient was calculated to be 0.062 4 cm-1atm-1 at high pressure, which was slightly higher than the air broadening coefficient in Hitran database.
(3)Measurement of pressure shift coefficient of nitrogen-induced
A group of center frequency of absorption line at different pressures was obtained by linear fitting of absorbance signals, as shown in Fig.5. It was seen that the absorption line moved to the long wave direction with pressure increasing, i.e., that is the "red shift" phenomenon. On the contrary, the center wavelength corresponding to the absorption peak shifted to the short-wave direction as the pressure decreasing, which is called "blue shift" phenomenon. There was a good linear relationship between the center frequency and the pressure. The intercept as the center frequency in experiment was 6 046.963 8 cm-1, which can be expressed as Eq.10. The slope as the pressure shift coefficient of nitrogen-induced was calculated as -0.00848 cm -1atm -1 at high pressure, which does not exist in the Hitran database.
![]()
Figure 5.Center frequency drift phenomenon
According to the above analysis, the unknown low concentration x can be measured as Eq.11 when the frequency corresponding to the peak value of the absorbance signal and the current pressure were known:
![]()
Figure 6.Calculated the pressure shift coefficient of nitrogen-induced
In TDLAS system, the amplitude of the wavelength scanning signal was within a certain range to ensure the normal operation of the laser. As the pressure increased, the absorption signal linewidth had gradually increased, while the proportion of the directly detected signal without absorption part gradually decreased. Therefore, Lorentz line-type fitting results of absorbance signal were incomplete (as shown of dotted line in Fig.7) which results in the concentration inversion deviation augment.
![]()
Figure 7.Absorbance signals of different concentration at high pressure
In the experiment, a group of methane standard gases with different concentrations were transported into the high-pressure absorption cell, and the absorbance signals after air pressure stabilizing were obtained as shown in Fig.7. The gas concentration can be inverted according to Eq.11 with the center frequency of absorption signal and the pressure, that the maximum relative error of 0.2% methane concentration was calculated as 4.0%, as shown in Table 2. This method provided another method for concentration inversion in the condition of absorbance signals severe broadening at high pressure.
| 1 | 0.500 | 0.512 | 2.40 |
| 2 | 0.400 | 0.390 | 2.50 |
| 3 | 0.300 | 0.311 | 3.67 |
| 4 | 0.200 | 0.208 | 4.00 |
Table 2. Methane standard gas concentration and inverted concentration
4 Conclusions
In Conclusion, the methane absorption spectrum at 6 046.96 cm-1 in high-pressure environment was measured with a spectrum detection platform by optimally extracting absorbance signals through empirical mode decomposition algorithm filtering and Lorentz line-type fitting. Then, the broadening characteristics of methane absorption spectrum at high pressure were studied. These studies show that the peak value of absorbance decreased and the linewidth increased with the pressure increasing. The methane-nitrogen mutual broadening coefficient measured at high pressure was about 0.062 4 cm-1atm-1, slightly higher than the air broadening coefficient in Hitran database. The pressure shift coefficient of nitrogen-induced under high pressure was -0.008 4 cm-1atm-1, which was not listed in Hitran database. The gas concentration can be inverted by measuring center frequency of absorption line when the absorbance cannot be effectively obtained in higher pressure condition with the corresponding relationship between the pressure shift coefficient of nitrogen-induced, gas concentration, center frequency and pressure. At the same time, the feasibility of the experimental system and spectrum processing algorithm was verified, which laid a foundation for subsequent research on gas spectral characteristics at high pressure.
References
[1] Y Aoyagi, H Osada, M Misawa. 2006-01-0077(2006).
[2] M Pantani, F Castagnoli, F D'Amato. Two infrared laser spectrometers for the in situ measurement of stratospheric gas concentration. Infrared physics & technology, 46, 109-113(2004).
[3] C Roller, K Namjou, J Jeffers. Simultaneous NO and CO2 measurement in human breath with a single IV-VI mid-infrared laser. Optics letters, 27, 107-109(2002).
[4] G B Rieker, J B Jeffries, R K Hanson. Calibration-free wavelength modulation spectroscopy for measurements of gas temperature and concentration in harsh environments. Applied Optics, 48, 5546-5560(2009).
[5] A Farooq, J Jeffries, R Hanson. High-pressure measurements of CO2 absorption near 2.7 μm: Line mixing and finite duration collision effects. Journal of Quantitative Apectroscopy and Radiative Tranfer, 111, 949(2010).
[8] P Michopoulos, G Baloutsos, A Economou. Effects of nitrogen deposition on nitrogen cycling in an Aleppo pine stand in Athens, Greece. Science of the Total Environment, 323, 211-218(2004).
[9] N E Huang, Z Shen, S R Long. The empirical mode decomposition and the Hilbert spectrum for nonlinear and non-stationary time series analysis. Proceedings of the Royal Society, 454, 903-995(1998).
[11] J S Li, B L Yu, H Fischer. Wavelet transform based on the optimal wavelet pairs for tunable diode laser absorption spectroscopy signal processing. Applied Spectroscopy, 69, 496-506(2015).


Set citation alerts for the article
Please enter your email address

© Copyright 2018-2021 | Chinese Laser Press. All Rights Reserved 沪ICP备15018463号-20