• Infrared and Laser Engineering
  • Vol. 51, Issue 2, 20220022 (2022)
Jian Lu, Zhijian Xie*, and Hongchao Zhang
Author Affiliations
  • School of Science, Nanjing University of Science and Technology, Nanjing 210094, China
  • show less
    DOI: 10.3788/IRLA20220022 Cite this Article
    Jian Lu, Zhijian Xie, Hongchao Zhang. Light beam induced current mapping to characterize damage characteristics of silicon solar cell irradiated by continuous-wave laser[J]. Infrared and Laser Engineering, 2022, 51(2): 20220022 Copy Citation Text show less
    Diagram of the light path in experiment of laser irradiation of solar cell
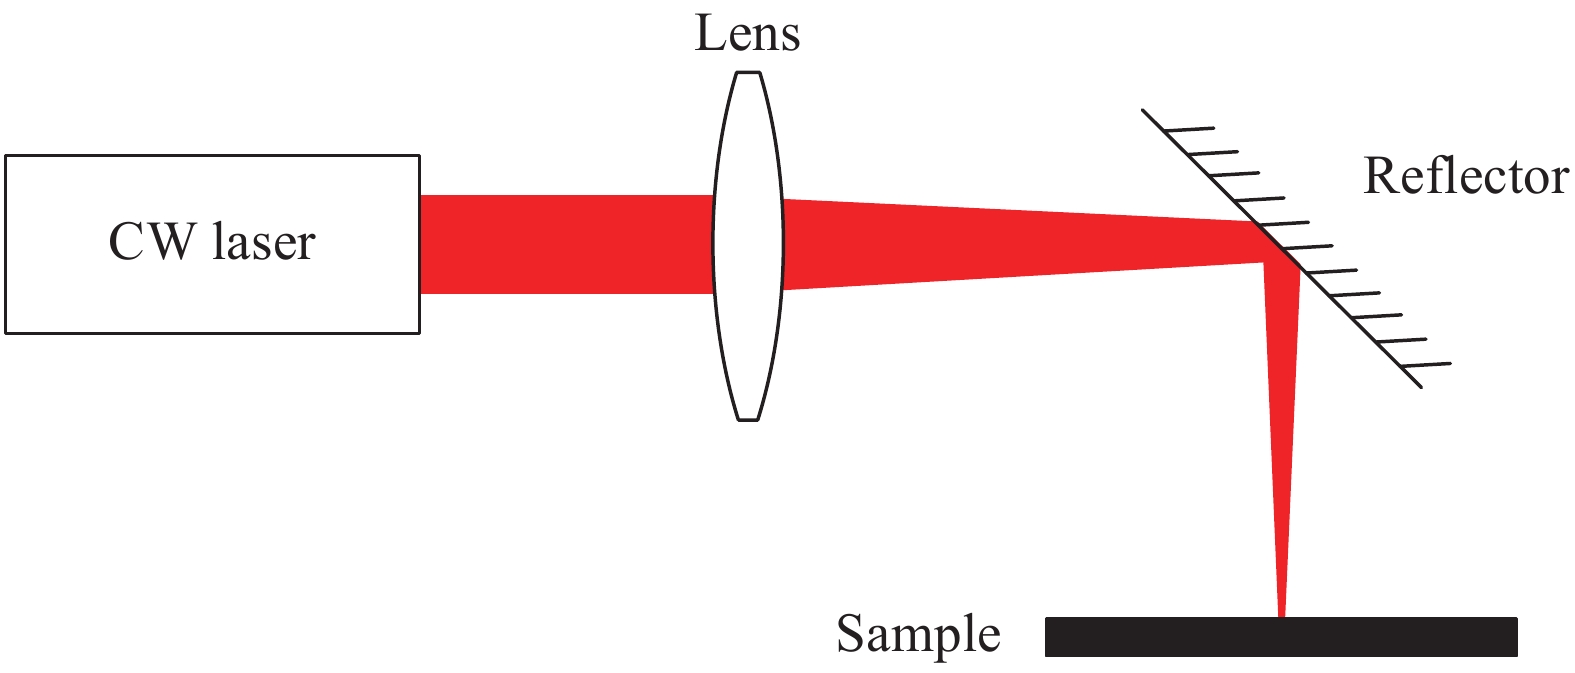
    Fig. 1. Diagram of the light path in experiment of laser irradiation of solar cell
    Diagram of LBIC mapping system
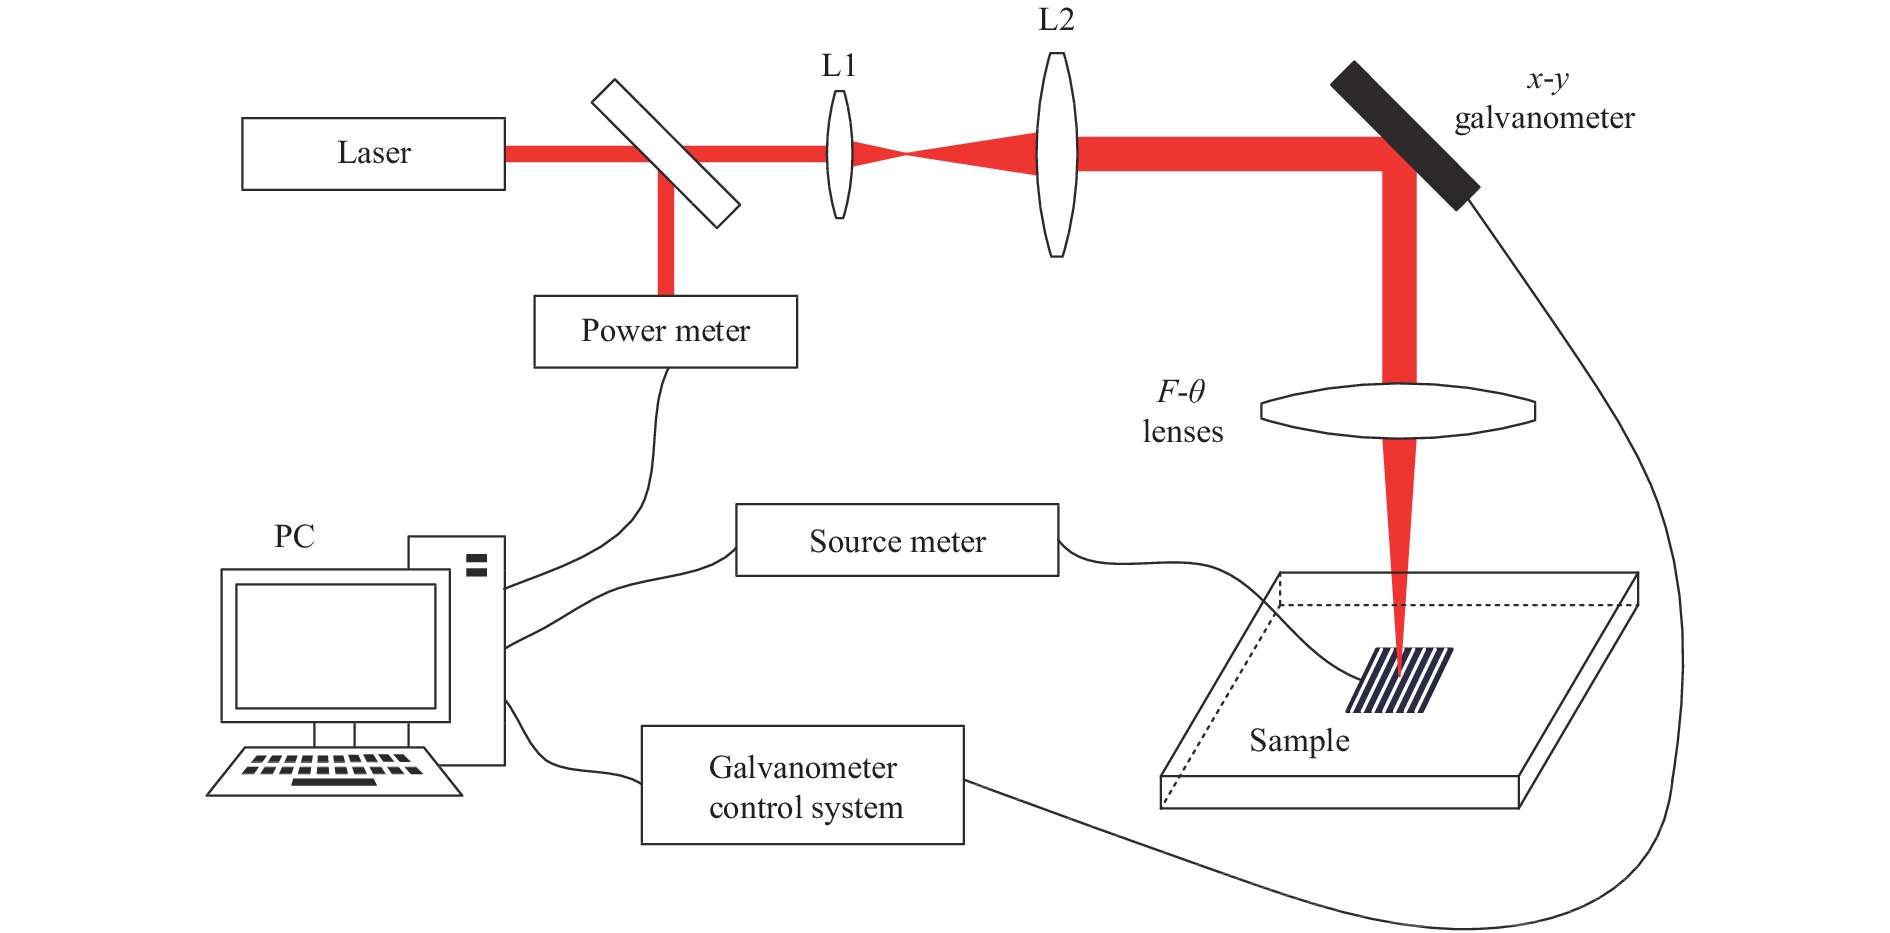
    Fig. 2. Diagram of LBIC mapping system
    Surface images of solar cells after laser irradiation with different power densities
    Fig. 3. Surface images of solar cells after laser irradiation with different power densities
    Voltage-current characteristic curves of solar cells in dark environment after laser irradiation with different power densities
    Fig. 4. Voltage-current characteristic curves of solar cells in dark environment after laser irradiation with different power densities
    650 nm LBIC maps of solar cells after laser irradiation
    Fig. 5. 650 nm LBIC maps of solar cells after laser irradiation
    980 nm LBIC maps of solar cells after laser irradiation
    Fig. 6. 980 nm LBIC maps of solar cells after laser irradiation
    Surface images of solar cells after laser irradiation on fingers. Two (a), three (b), and five (c) adjacent fingers
    Fig. 7. Surface images of solar cells after laser irradiation on fingers. Two (a), three (b), and five (c) adjacent fingers
    Voltage-current characteristic curves of solar cell in dark environment after laser irradiation on fingers
    Fig. 8. Voltage-current characteristic curves of solar cell in dark environment after laser irradiation on fingers
    650 nm LBIC maps of solar cell after laser irradiation on fingers. Two (a), three (b), and five (c) adjacent fingers
    Fig. 9. 650 nm LBIC maps of solar cell after laser irradiation on fingers. Two (a), three (b), and five (c) adjacent fingers
    Power density/W·cm−2Series resistance/ΩSeries resistance drop percentageShunt resistance/ΩShunt resistance drop percentage
    Before irradiation1.35-6543.74-
    483.20.1390.4%5060.0122.7%
    563.70.1787.4%1747.8873.3%
    644.20.3276.3%170.3397.4%
    724.80.1489.6%643.0690.2%
    805.30.1191.9%141.1097.8%
    Table 1. Series resistance and shunt resistance of solar cells after laser irradiation with different power densities
    Power density/W·cm-2Minimum current in damaged area/μACurrent away from the damaged area/μADrop percentage
    483.254.8877.3429.0%
    563.715.0575.9780.2%
    644.214.1476.0581.4%
    724.815.9278.4279.7%
    805.314.8275.7580.4%
    Table 2. Percentage of solar cell current drop after laser irradiation with different power densities (650 nm)
    Power density/W·cm-2Damage area/mm2Percentage of damaged area in spot area
    483.20.5718.2%
    563.72.7487.2%
    644.22.3273.7%
    724.83.39107.8%
    805.35.08161.9%
    Table 3. Damaged area of solar cells after laser irradiation with different power densities(980 nm)
    Irradiation positionSeries resistance/ΩSeries resistance drop percentageShunt resistance/ΩShunt resistance drop percentage
    Before0.40-299.82-
    Two adjacent fingers0.1757.5%94.6668.4%
    Three adjacent fingers0.0880.0%76.3574.5%
    Five adjacent fingers0.0782.5%53.1882.3%
    Table 4. Series resistance and shunt resistance of solar cells after laser irradiation on fingers
    Irradiation positionCurrent on the side away from the electrode lead/μACurrent on the side close to the electrode lead/μADrop percentage
    Two adjacent fingers207.77243.9214.8%
    Three adjacent fingers198.97232.7314.5%
    Five adjacent fingers40.57243.9683.4%
    Table 5. Percentage of solar cell current drop after laser irradiation on fingers (650 nm)
    Jian Lu, Zhijian Xie, Hongchao Zhang. Light beam induced current mapping to characterize damage characteristics of silicon solar cell irradiated by continuous-wave laser[J]. Infrared and Laser Engineering, 2022, 51(2): 20220022
    Download Citation