• High Power Laser Science and Engineering
  • Vol. 9, Issue 2, 02000e12 (2021)
Sang-Hoon Nam1, Garima C. Nagar2, Dennis Dempsey2, Ondřej Novák3, Bonggu Shim2, and Kyung-Han Hong1、4、*
Author Affiliations
  • 1Research Laboratory of Electronics, Massachusetts Institute of Technology (MIT), Cambridge, MA02139, USA
  • 2Department of Physics, Applied Physics and Astronomy, Binghamton University, State University of New York, Binghamton, NY13902, USA
  • 3HiLASE Centre, Institute of Physics of the Czech Academy of Sciences, 25241 Dolní Břežany, Czech Republic
  • 4Presently with MIT Lincoln Laboratory, Lexington, MA02420, USA
  • show less
    DOI: 10.1017/hpl.2021.1 Cite this Article Set citation alerts
    Sang-Hoon Nam, Garima C. Nagar, Dennis Dempsey, Ondřej Novák, Bonggu Shim, Kyung-Han Hong. Multi-octave-spanning supercontinuum generation through high-energy laser filaments in YAG and ZnSe pumped by a 2.4 μm femtosecond Cr:ZnSe laser[J]. High Power Laser Science and Engineering, 2021, 9(2): 02000e12 Copy Citation Text show less
    Schematic diagram of experimental setups. (a) Femtosecond Cr:ZnSe CPA laser, composed of mode-locked Cr:ZnS laser oscillator, Cr:ZnSe regenerative amplifier, and stretcher/compressor unit. The dotted lines indicate the pump beam while solid lines, 2.4 μm beams. (b) Setup for laser filamentation in a solid. The arrows for spatial characterization indicate the far-field (left) and near-field (right) images of the laser filament, respectively. The spectral characterization is performed using multiple spectrometers. ND, neutral density filter; L1, f = 100 mm CaF2 lens; L2, f = 50 mm CaF2 lens.
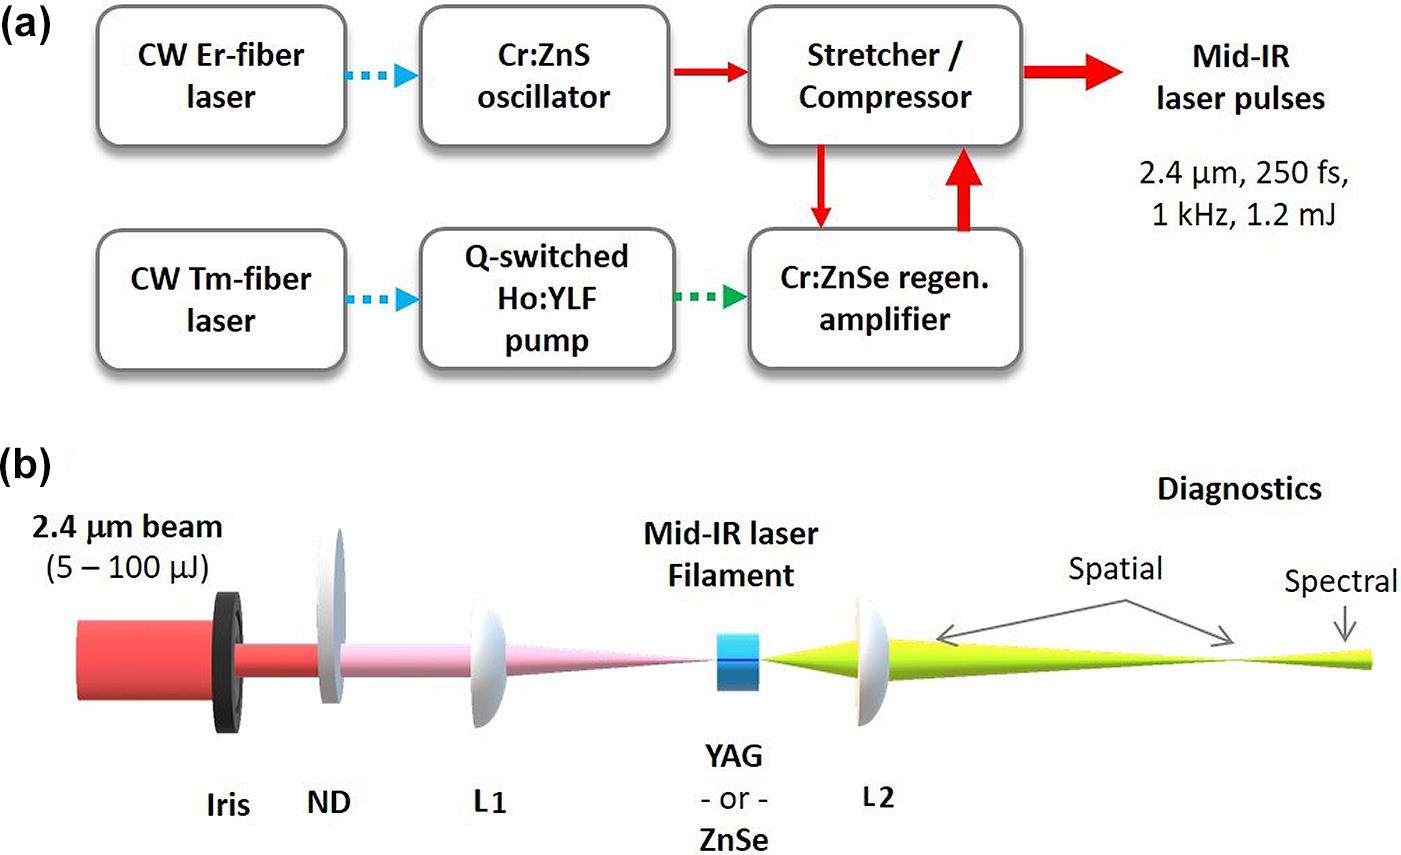
    Fig. 1. Schematic diagram of experimental setups. (a) Femtosecond Cr:ZnSe CPA laser, composed of mode-locked Cr:ZnS laser oscillator, Cr:ZnSe regenerative amplifier, and stretcher/compressor unit. The dotted lines indicate the pump beam while solid lines, 2.4 μm beams. (b) Setup for laser filamentation in a solid. The arrows for spatial characterization indicate the far-field (left) and near-field (right) images of the laser filament, respectively. The spectral characterization is performed using multiple spectrometers. ND, neutral density filter; L1, f = 100 mm CaF2 lens; L2, f = 50 mm CaF2 lens.
    Dispersion curves of YAG and ZnSe versus wavelength. The dotted line shows the pump wavelength of 2.4 μm.
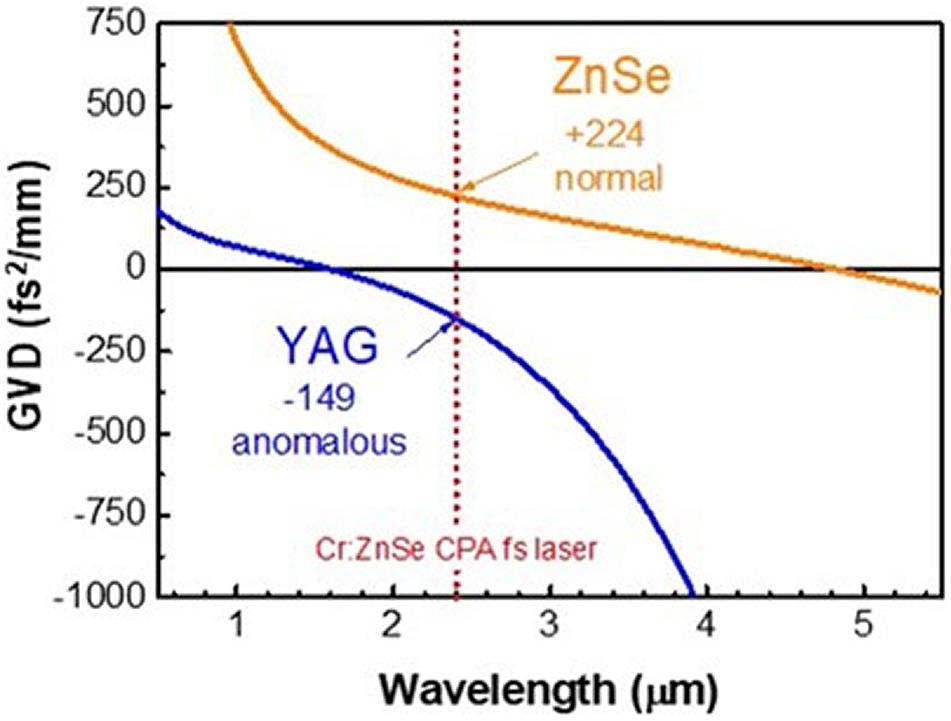
    Fig. 2. Dispersion curves of YAG and ZnSe versus wavelength. The dotted line shows the pump wavelength of 2.4 μm.
    Laser filamentation and SCG in YAG: (a) a laser filament in a 6-mm-long YAG sample; (b) the visible spectrum (linear scale), where the inset is the corresponding far-field beam profile in red and green (true color); and (c) SC spectrum (solid) at 15 μJ, 2.4 μm input (dotted) in logarithmic scale.
    Fig. 3. Laser filamentation and SCG in YAG: (a) a laser filament in a 6-mm-long YAG sample; (b) the visible spectrum (linear scale), where the inset is the corresponding far-field beam profile in red and green (true color); and (c) SC spectrum (solid) at 15 μJ, 2.4 μm input (dotted) in logarithmic scale.
    Laser filamentation and SCG in ZnSe: (a) a laser filament in a 6-mm-long polycrystalline ZnSe sample; (b) the visible spectrum (linear scale) showing FHG without SCG, where the inset is the corresponding far-field beam profile in yellow; (c) SC spectrum (solid) at 15 μJ, 2.4 μm input (dashed) in logarithmic scale. The absorption peak at ~4.3 μm is from atmospheric CO2. The well-defined SHG peak is observed at ~1.2 μm.
    Fig. 4. Laser filamentation and SCG in ZnSe: (a) a laser filament in a 6-mm-long polycrystalline ZnSe sample; (b) the visible spectrum (linear scale) showing FHG without SCG, where the inset is the corresponding far-field beam profile in yellow; (c) SC spectrum (solid) at 15 μJ, 2.4 μm input (dashed) in logarithmic scale. The absorption peak at ~4.3 μm is from atmospheric CO2. The well-defined SHG peak is observed at ~1.2 μm.
    Spectral broadening of incident wavelength of 2.4 μm in a 6-mm-long (a) YAG and (b) ZnSe versus energy and its near-field image. The input pulse energies are 10, 25, 50, and 100 μJ. The logarithmic scale of intensity spectra is used to highlight the fine spectral features. Near-field intensity distributions with the magnification of ~2 at the output surface of the YAG (right column in (a)) and ZnSe (right column in (b)), as measured in the single and multiple filamentation regimes with the variation of input energy. The white scale bars correspond to 0.4 mm in length.
    Fig. 5. Spectral broadening of incident wavelength of 2.4 μm in a 6-mm-long (a) YAG and (b) ZnSe versus energy and its near-field image. The input pulse energies are 10, 25, 50, and 100 μJ. The logarithmic scale of intensity spectra is used to highlight the fine spectral features. Near-field intensity distributions with the magnification of ~2 at the output surface of the YAG (right column in (a)) and ZnSe (right column in (b)), as measured in the single and multiple filamentation regimes with the variation of input energy. The white scale bars correspond to 0.4 mm in length.
    UPPE numerical simulations of SCG in YAG. (a) Simulated on-axis (r = 0) spectra and (b) spatially averaged spectra at different propagation distances with the input pulse energy of 50 μJ. (c) Spatiotemporal intensity profile showing self-compression at the end of propagation through YAG and (d) normalized on-axis electric field.
    Fig. 6. UPPE numerical simulations of SCG in YAG. (a) Simulated on-axis (r = 0) spectra and (b) spatially averaged spectra at different propagation distances with the input pulse energy of 50 μJ. (c) Spatiotemporal intensity profile showing self-compression at the end of propagation through YAG and (d) normalized on-axis electric field.
    Numerical simulations of SCG in ZnSe. (a) Simulated on-axis (r = 0) spectra and (b) spatially averaged spectra with different propagation distances at 10 μJ of input pulse energy. (c) Spatiotemporal intensity profile and (d) normalized on-axis electric field.
    Fig. 7. Numerical simulations of SCG in ZnSe. (a) Simulated on-axis (r = 0) spectra and (b) spatially averaged spectra with different propagation distances at 10 μJ of input pulse energy. (c) Spatiotemporal intensity profile and (d) normalized on-axis electric field.
    ParametersYAGZnSe
    Eg (eV)6.52.71
    n01.7932.423
    n2 (×10–16 cm2/W)6.222
    λ0 (μm)1.604.85
    Pcr (MW)7.70.53
    Table 1. Optical parameters of YAG and ZnSe at 2.4 μm. Eg, energy bandgap[28]; n0, refractive index at 2.4 μm; n2, nonlinear index of refraction evaluated at 2.4 μm[29,30]; λ0, ZDW; Pcr, estimated critical power for self-focusing.
    Sang-Hoon Nam, Garima C. Nagar, Dennis Dempsey, Ondřej Novák, Bonggu Shim, Kyung-Han Hong. Multi-octave-spanning supercontinuum generation through high-energy laser filaments in YAG and ZnSe pumped by a 2.4 μm femtosecond Cr:ZnSe laser[J]. High Power Laser Science and Engineering, 2021, 9(2): 02000e12
    Download Citation