
Fajun Xiao, Wuyun Shang, Weiren Zhu, Lei Han, Malin Premaratne, Ting Mei, Jianlin Zhao. Cylindrical vector beam-excited frequency-tunable second harmonic generation in a plasmonic octamer[J]. Photonics Research, 2018, 6(3): 157
- Photonics Research
- Vol. 6, Issue 3, 157 (2018)
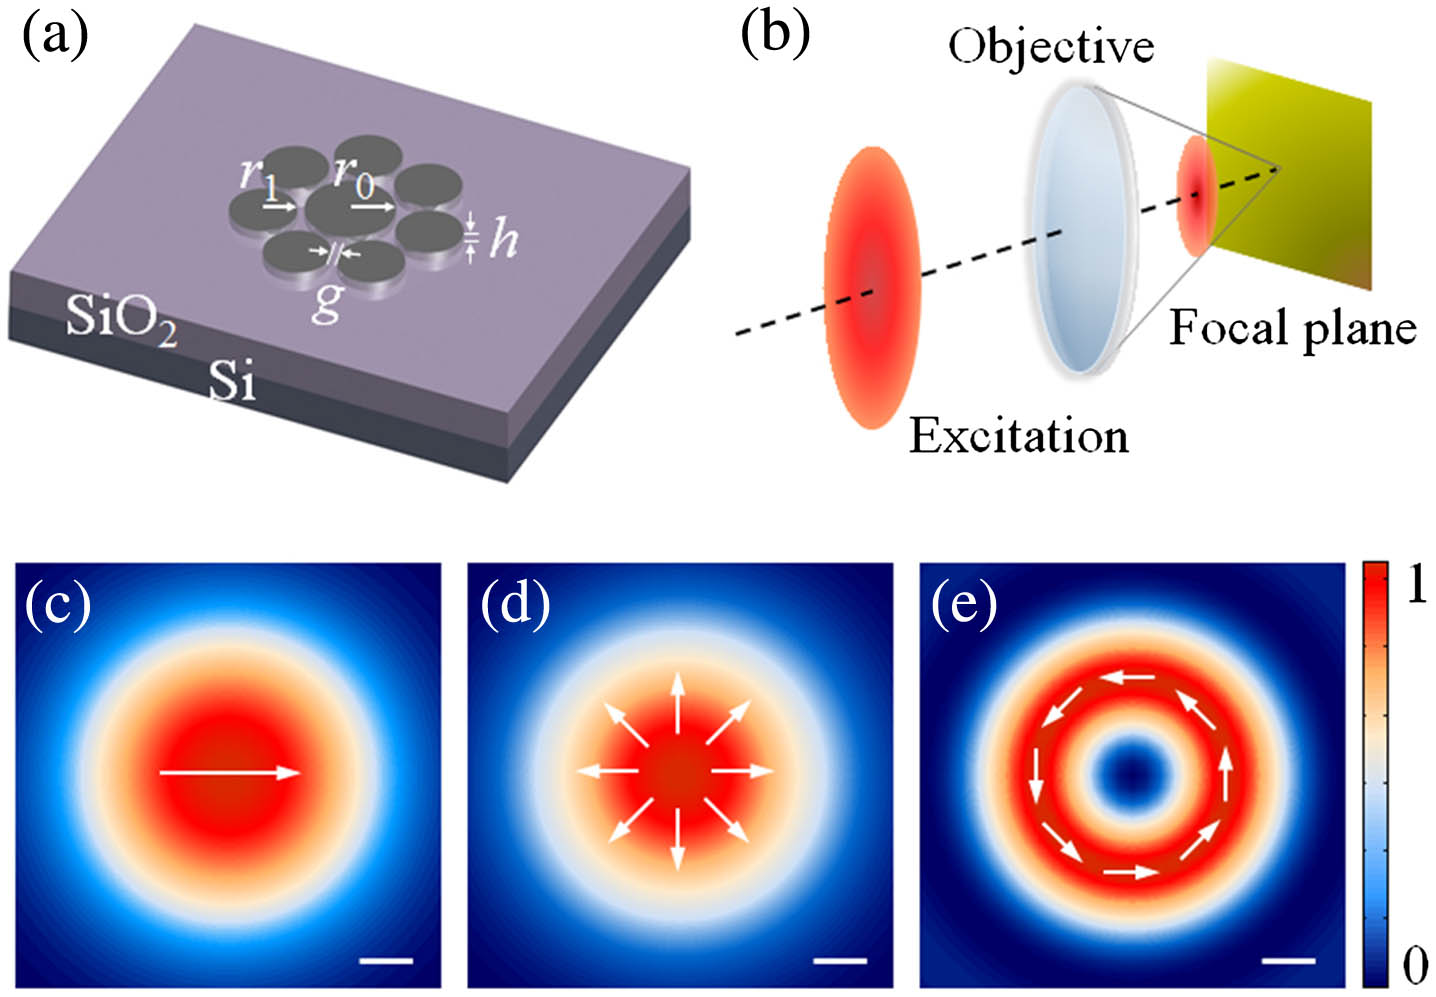
Fig. 1. (a) Schematic view of the Ag octamer on a Si / SiO 2 r 0 r 1 g h x
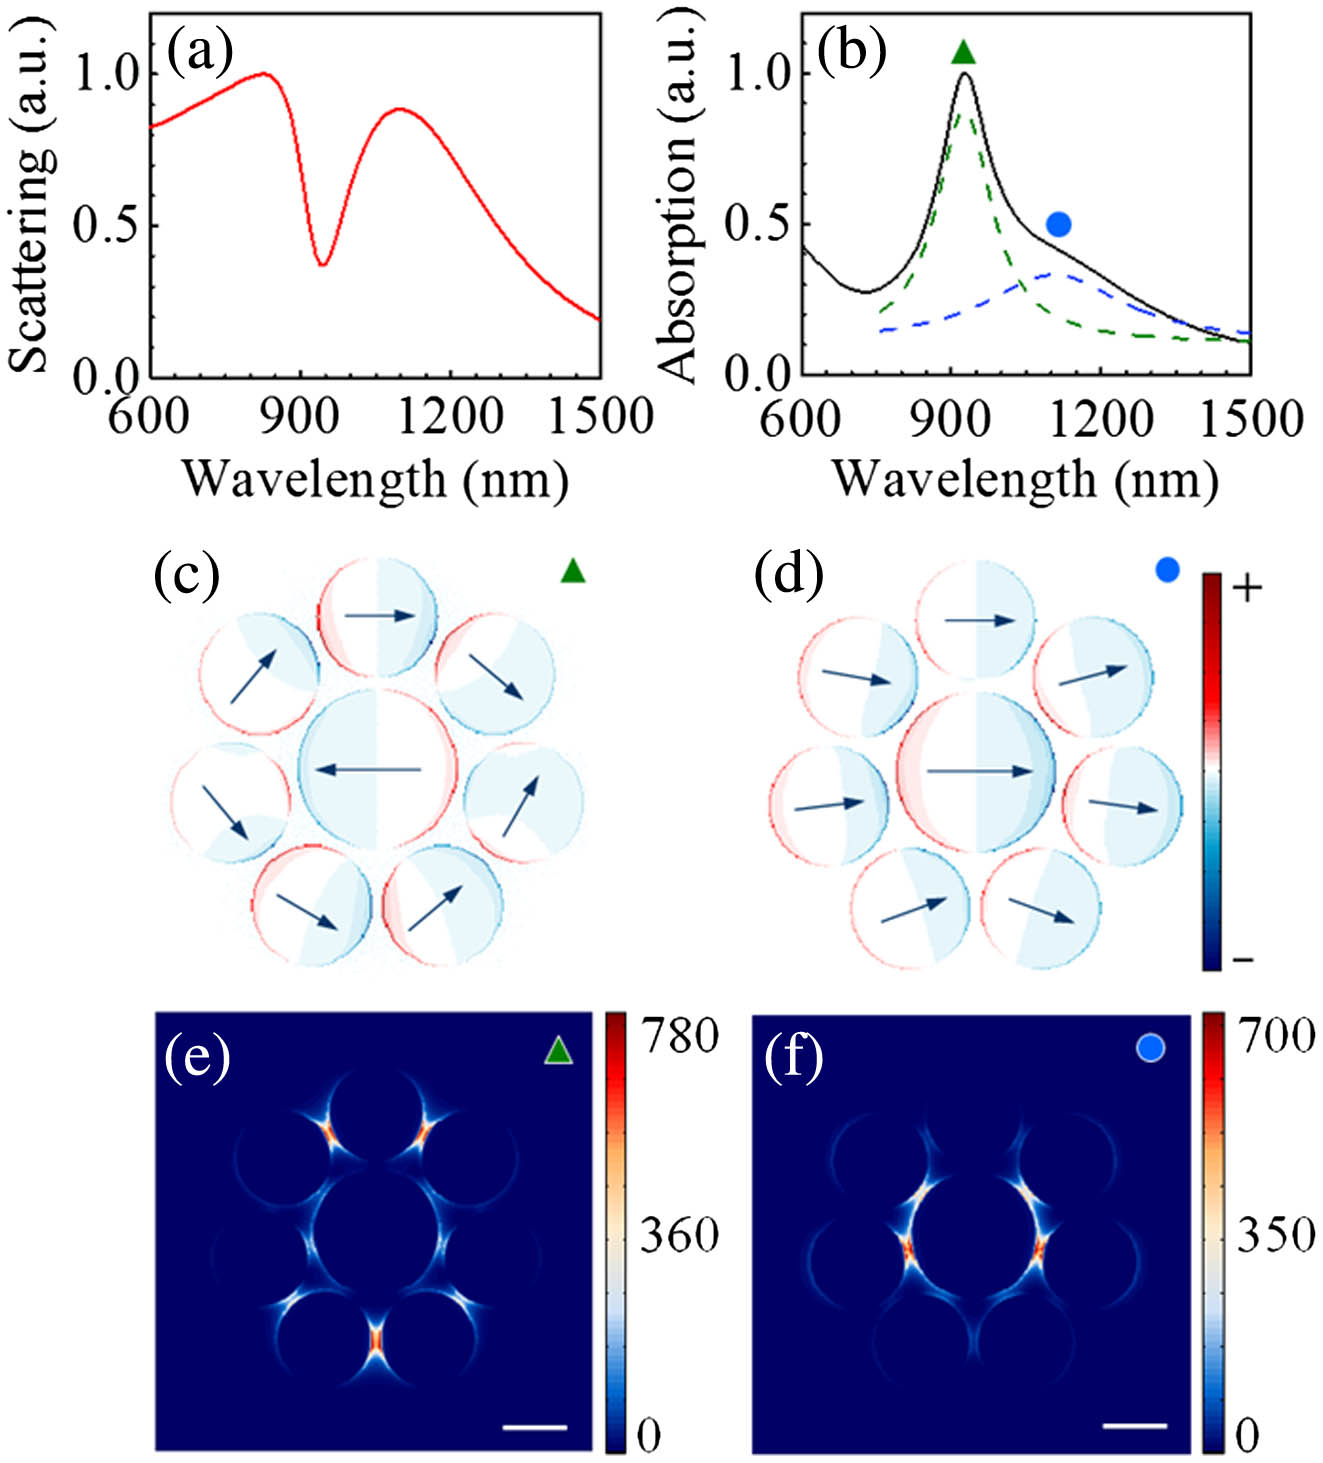
Fig. 2. Normalized (a) scattering and (b) absorption spectra of the octamer under excitation of x
Fig. 3. Normalized (a) SHG and (b) intensity enhancement spectra of the octamer illuminated by the x
Fig. 4. Normalized scattering spectra of the octamer under excitations of (a) radially and (b) azimuthally polarized vector beams. Charge distributions of (c), (d) radial breathing modes (RBMs) and (e) azimuthally arranged dipolar mode (ADM) at the labeled wavelengths in (a) and (b), respectively. The dashed lines in (c) and (d) represent the node positions of these two modes. Intensity enhancement maps of (f), (g) two RBMs and (h) ADM at the top surface of the octamer. The scale bars in (f)–(h) are 100 nm.
Fig. 5. (a), (b) SHG spectra of the octamer normalized by the maximum value of SHG intensity produced by the x

Set citation alerts for the article
Please enter your email address
© Copyright 2018-2021 | Chinese Laser Press. All Rights Reserved 沪ICP备15018463号-20