
Yanping Lan, Songtao Lai, Yile Shi, Zhijun Ren, Yixian Qian. Tunable Non-Paraxial Accelerating Beams[J]. Acta Optica Sinica, 2019, 39(10): 1026001
- Acta Optica Sinica
- Vol. 39, Issue 10, 1026001 (2019)
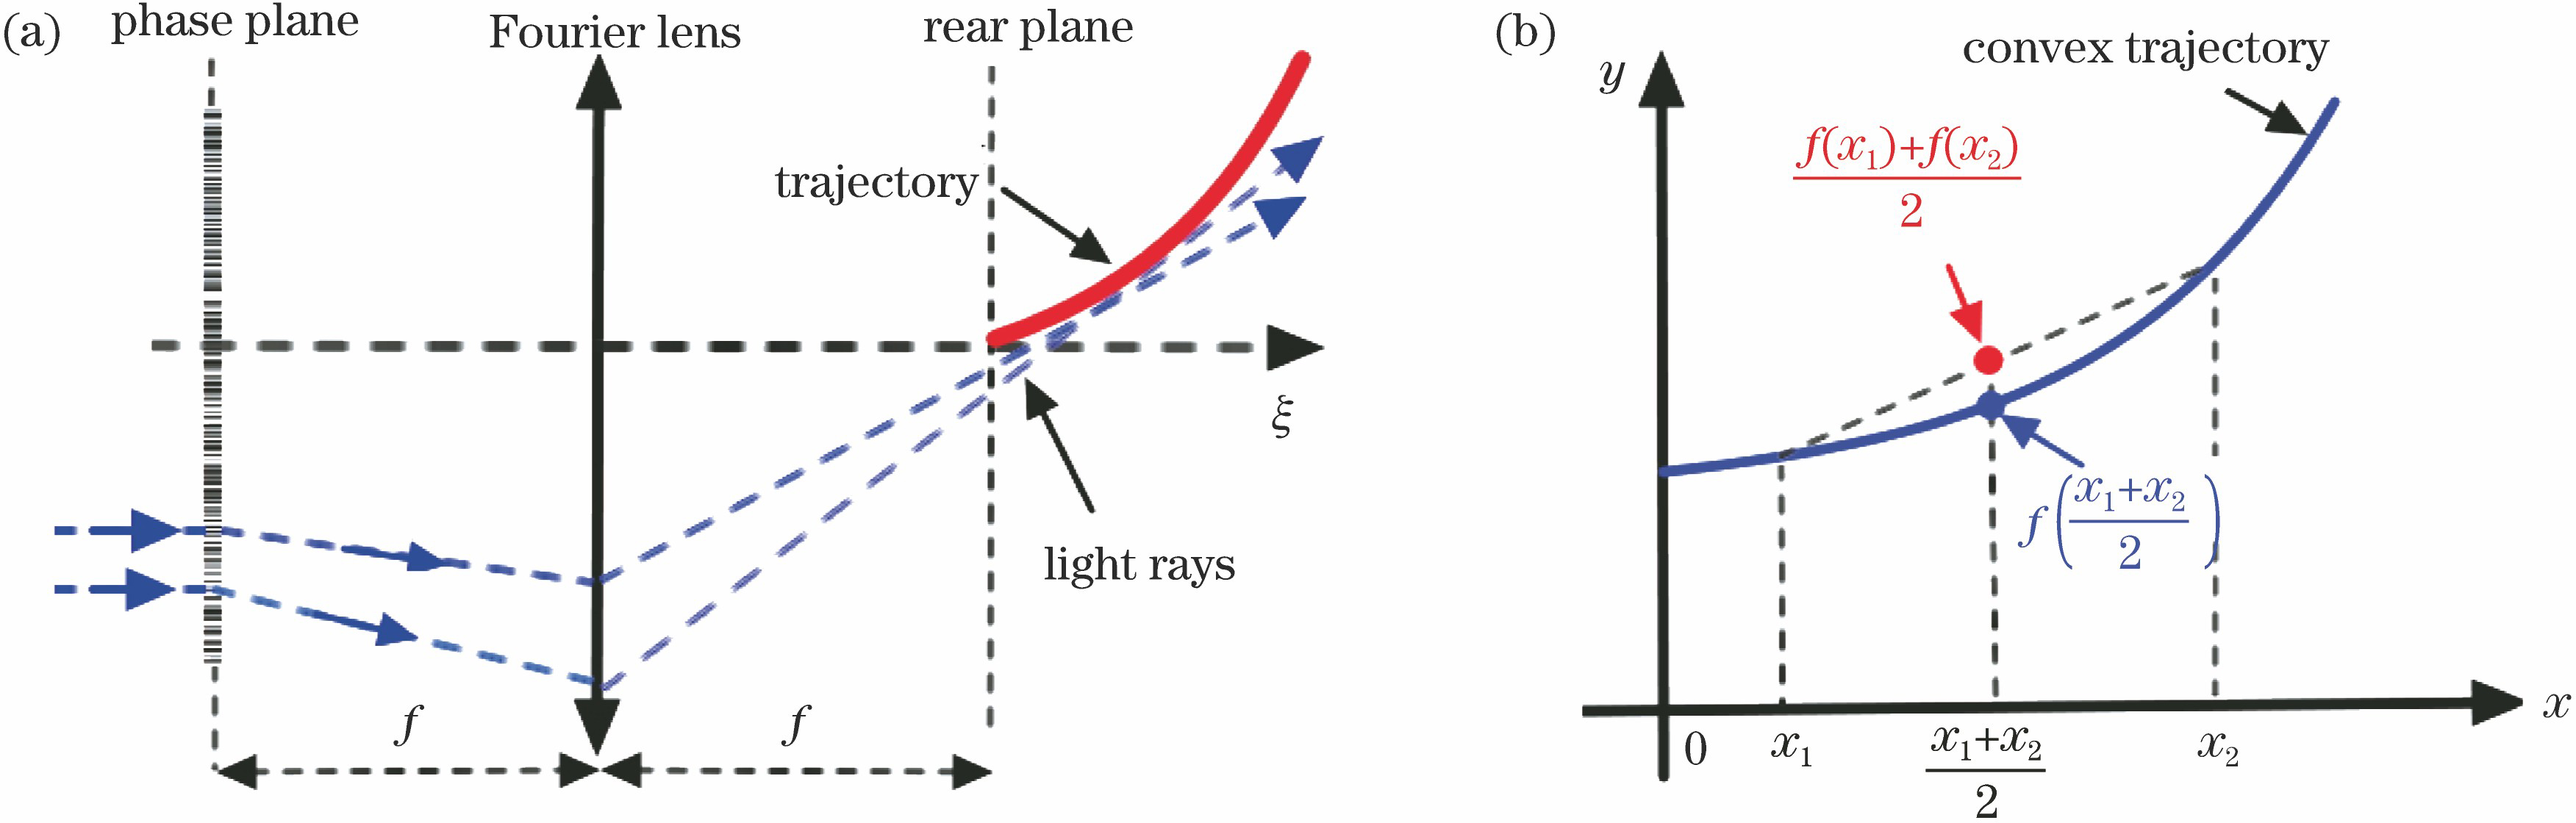
Fig. 1. Mechanism of generating accelerating beams. (a) Schematic for generating accelerating beams by spectral phase modulation; (b) definition of convex trajectory
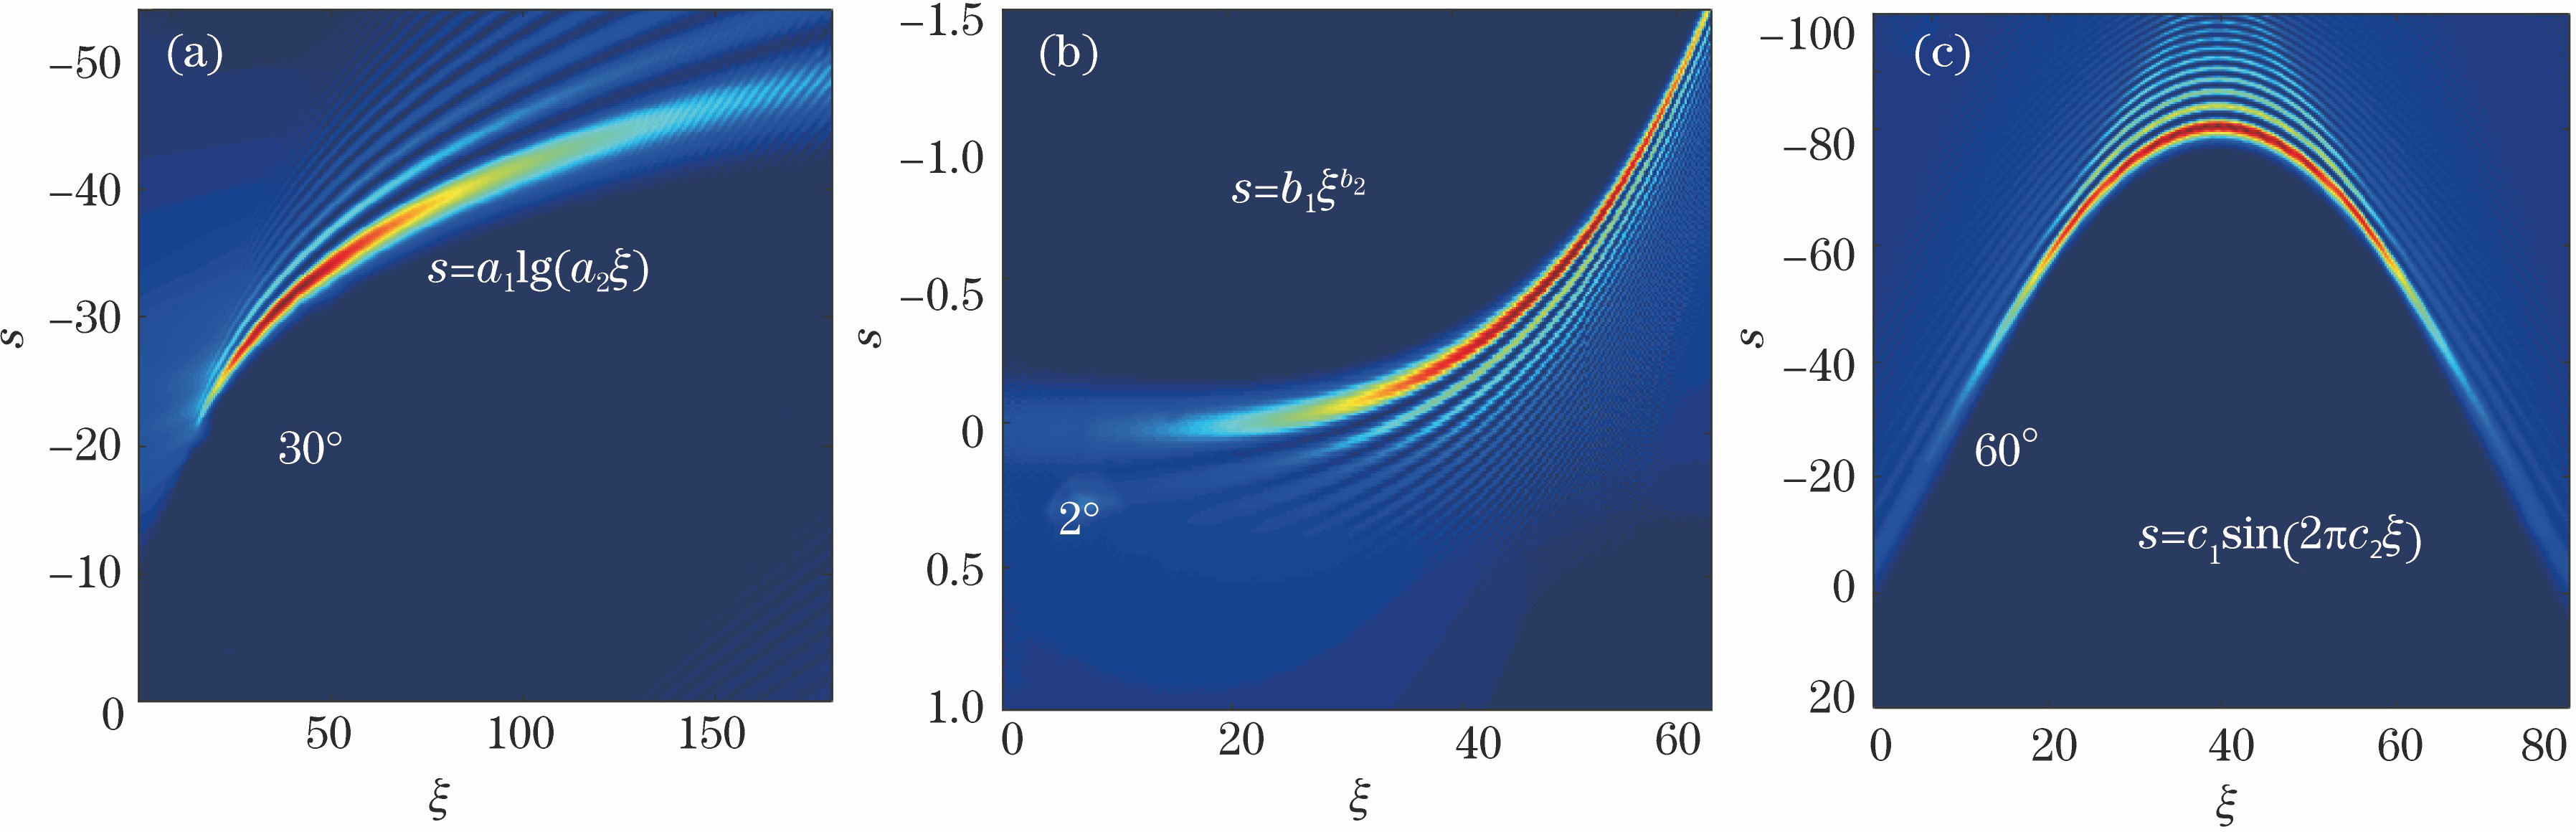
Fig. 2. One-dimensional optical field evolutions of tunable accelerating beams. (a) Logarithmic trajectory, a 1=10, a 2=0.6; (b) fourth-power trajectory, b 1=10-7, b 2=4; (c) sinusoidal trajectory, c 1=80, c 2=160
Fig. 3. Two-dimensional sinusoidal accelerating beams. (a) Propagation evolution slices of two-dimensional sinusoidal accelerating beams; (b) theoretical propagation trajectory in sx -ξ plane. Circles represent positions of main lobe, and solid and dotted curves denote ideal propagation sinusoidal trajectories in Fig. 3
Fig. 4. Experimental setup
Fig. 5. Accelerating beam with circular trajectory. (a) One-dimensional optical field evolution and inset in upper right corner is schematic of generating caustics, where solid curve represents accelerating beam with circular trajectory, solid lines without arrows represent cluster of rays, and dotted line represents rear focal plane of lens; (b1)-(b3) numerical intensity distributions at different distances: ξ =10,35,50; (c1)-(c3) experimental intensity distributions at different distan

Set citation alerts for the article
Please enter your email address
© Copyright 2018-2021 | Chinese Laser Press. All Rights Reserved 沪ICP备15018463号-20