
Yang Cao, Yue Li, Xiaohong Li. Research on Construction Method of Polarization Code in Wireless Optical Communication[J]. Acta Optica Sinica, 2020, 40(21): 2106003
- Acta Optica Sinica
- Vol. 40, Issue 21, 2106003 (2020)
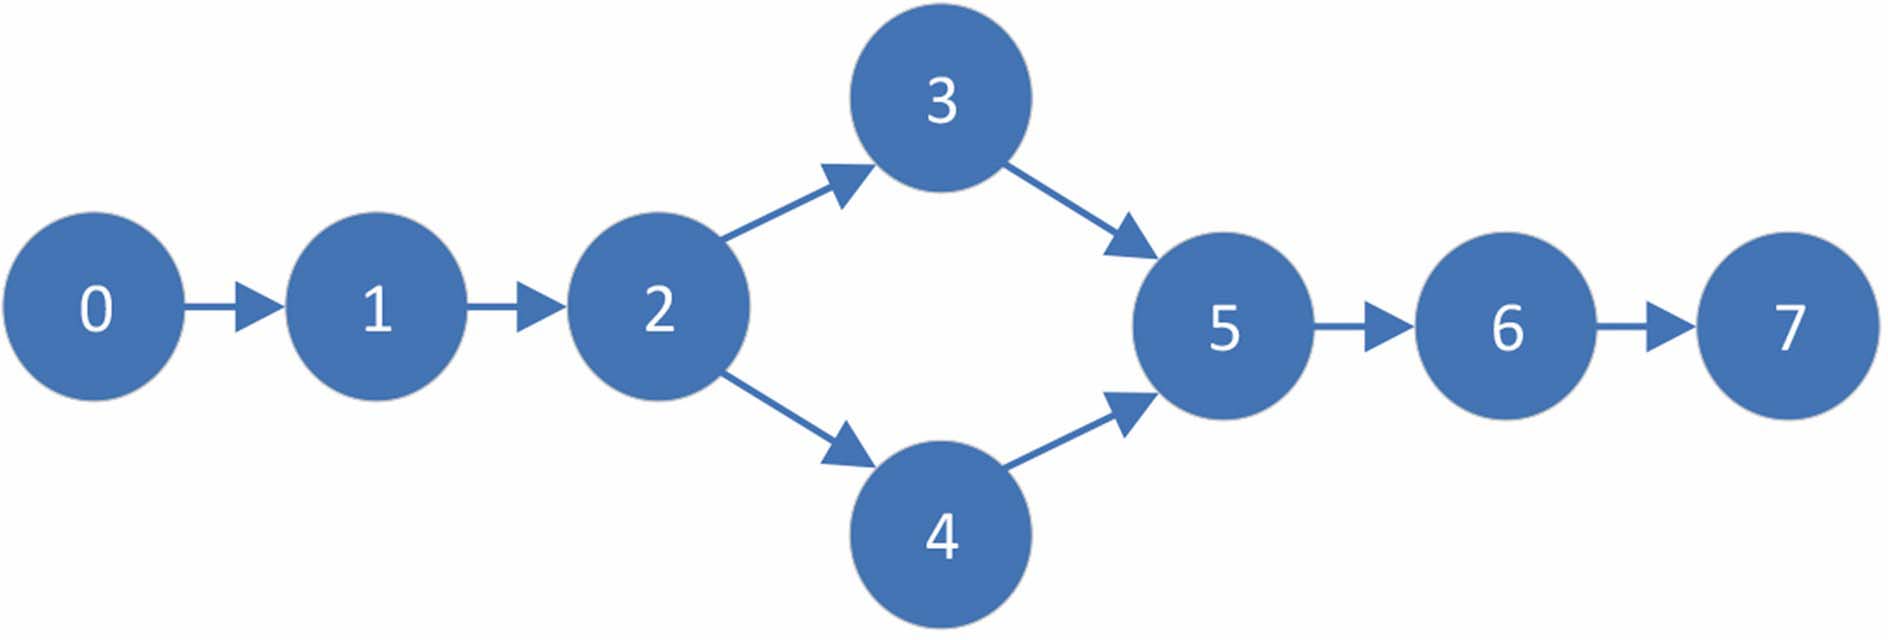
Fig. 1. Hasse diagram with N=8
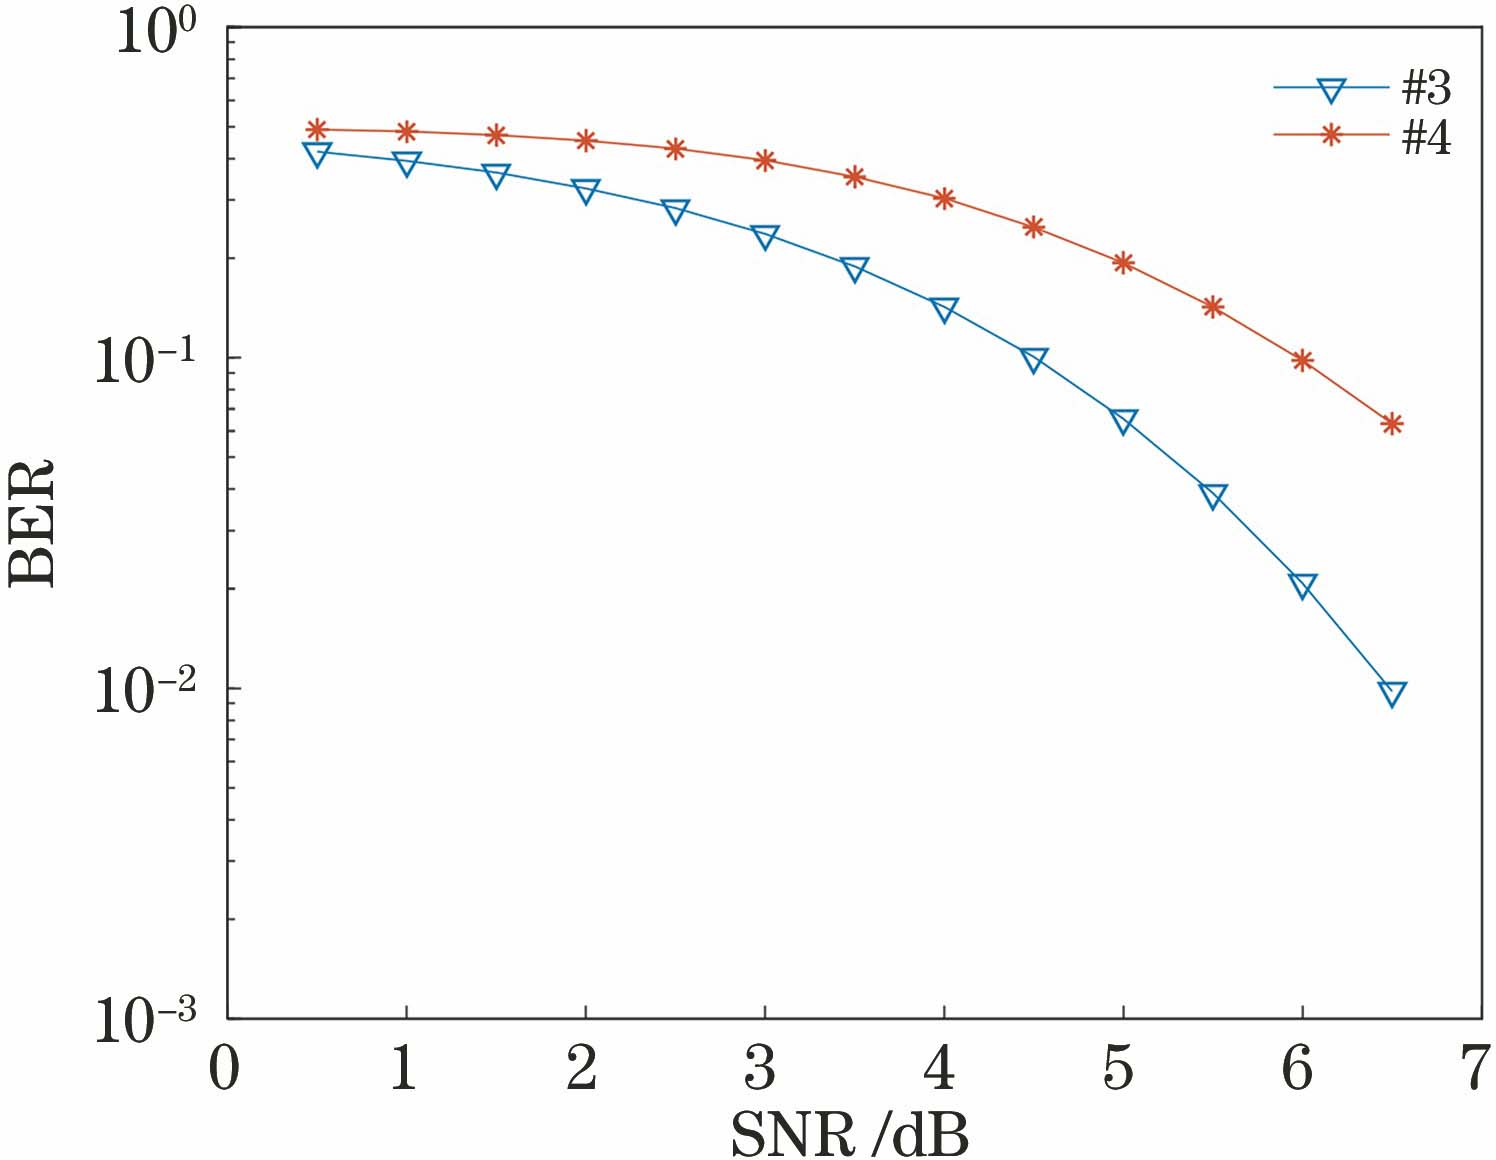
Fig. 2. BER of subchannels 3 and 4 under weak turbulence
Fig. 3. BER of subchannels (6, 9) (3, 8) (7, 12) under weak turbulence
Fig. 4. BER of subchannels (7, 24) (11, 24) (13, 24) (14, 19) (15, 28) under weak turbulence
Fig. 5. Flowchart of constructing polarization codes by TUPO method
Fig. 6. Reliability of each subchannel when N=512
Fig. 7. Comparison of BER under different code lengths and code rates
Fig. 8. Comparison of BER under different turbulence intensity
|
Table 1. Reliability relationship ratio of subchannels
|
Table 2. Range of β values when N=16
|
Table 3. Range of β values when N=32
|
Table 4. Number of subchannels to be determined for different code lengths
|
Table 5. Range of β values at different code length

Set citation alerts for the article
Please enter your email address
© Copyright 2018-2021 | Chinese Laser Press. All Rights Reserved 沪ICP备15018463号-20