
Sergio Davis, Felipe González-Cataldo, Gonzalo Gutiérrez, Gonzalo Avaria, Biswajit Bora, Jalaj Jain, José Moreno, Cristian Pavez, Leopoldo Soto. A model for defect formation in materials exposed to radiation[J]. Matter and Radiation at Extremes, 2021, 6(1): 015902
- Matter and Radiation at Extremes
- Vol. 6, Issue 1, 015902 (2021)
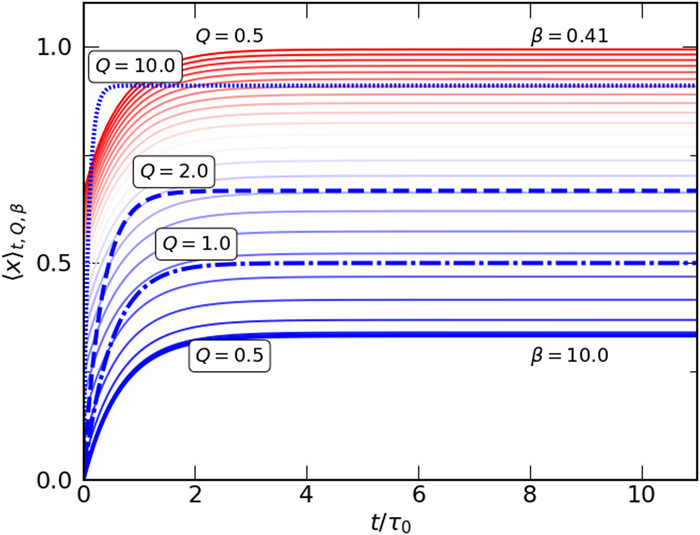
Fig. 1. Evolution of average fraction of defects, given by x t , Q , β = Q 1 + Q 1 − exp ( − t ( 1 + Q ) ) + x eq ( β ) (15) , as a function of exposure time t . The temperature β = 1/k B T is expressed in units of 1/E v , and the power flux Q is expressed in units of Q 0.
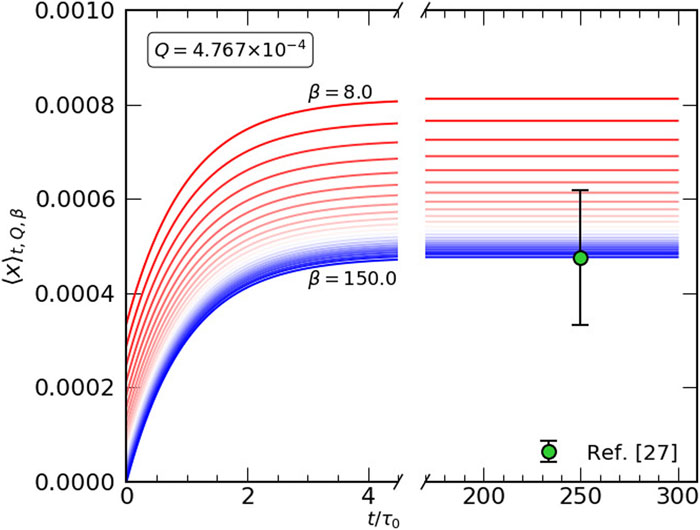
Fig. 2. Average fraction of defects for Q * = 4.76 × 10⁻⁴Q 0 as a function of exposure time t . The filled circle corresponds to the predicted fraction of defects for the case of tungsten exposed to power flux Q * for t * = 75 ns.27 This value is consistent with melting, as we observed in our experiment, because a fraction of defects of between 10−4 and 10−3 is required to melt a material.54,58–60
Fig. 3. Asymptotic values x max Q and β . The contour lines indicate combinations of Q and β that lead to the same value of x max
Fig. 4. Average fraction of defects as a function of exposure time for different values of integral damage factor (IDF) F .
Fig. 5. Maximum fraction of defects as a function of IDF F = Q t (25) .
Fig. 6. Maximum fraction of defects as a function of normalized IDF F /F 0, up to F = 0.6 F 0. The blue curve is the numerical solution of Eqs. (B1) and (B2) , and the orange curve is the linear approximation in Eq. (25) .
Fig. 7. Maximum effective temperature as a function of IDF, computed by matching x max(F ) to exp(−E v /k B T eff).
Fig. 8. Effective temperature T eff ( F ) = E v / k B ln ( 1 / x t ( F ) ) t along lines of constant IDF F (measured in units of W s1/2/cm2).


Set citation alerts for the article
Please enter your email address

© Copyright 2018-2021 | Chinese Laser Press. All Rights Reserved 沪ICP备15018463号-20