
Sergio Davis, Felipe González-Cataldo, Gonzalo Gutiérrez, Gonzalo Avaria, Biswajit Bora, Jalaj Jain, José Moreno, Cristian Pavez, Leopoldo Soto. A model for defect formation in materials exposed to radiation[J]. Matter and Radiation at Extremes, 2021, 6(1): 015902
- Matter and Radiation at Extremes
- Vol. 6, Issue 1, 015902 (2021)
Abstract
I. INTRODUCTION
The study of materials exposed to irradiation is a broad topic whose applications are fundamental for medicine,
A problem when designing and building a nuclear fusion reactor is selecting candidate materials for its plasma-facing components. The essential constraint is that such materials must resist extreme heat fluxes, together with high fluxes of neutrons, ion beams, and He and H isotopes such as deuterium. To test these materials, one must have access to experimental facilities that reproduce similar conditions to those expected on the materials in magnetic confinement (MC) fusion devices such as the projected ITER tokamak
The degree of damage suffered by a material under irradiation depends on several variables, including the interaction time between the plasma and the material, the peak power, and the energies deposited into the material. In practice, these quantities can vary significantly in different environments from MC to IC fusion experiments. In MC, most notably in ITER, energy loads in the divertor associated with edge localized modes
Among other irradiation facilities and devices (e.g., plasma guns, electron and ion accelerators, pulsed lasers), plasma focus (PF) devices have been used in recent years to probe these conditions because they reach similar IDF values through the high-power flux densities that they generate, thereby enabling material damage to be studied. After pinch compression, a PF device creates a plasma shock that is ejected axially and, when a material is exposed to it, can concentrate energies of 0.01 J/cm2–100 J/cm2 for interaction times of 10 ns–500 ns, depending on the distance from the anode to the target.
Thus, regardless of the wide varieties of effects and experimental setups, it seems possible to have a global descriptor with which to estimate the degree of damage. In this sense, the IDF F appears to be a useful indicator for comparing results from experiments of different types, but unfortunately a proper theoretical explanation of this empirical fact is lacking. Although some arguments have been put forward, there is clearly a need for a sound theoretical foundation for F from the atomic phenomena of the creation and recombination of defects.
In the present work, based on the continuous-time master equation, we propose a simple kinetic model that estimates the fraction of defects generated for a given input power flux Q and exposure time t. This model represents a starting point for understanding how F depends on the fraction of defects, giving a physical explanation for this empirical descriptor.
II. DERIVING MODEL FOR DEFECT FORMATION FROM MASTER EQUATION
We consider a material with N atomic sites in area A, which defines a surface atomic density of σ = N/A. The state of the sample at time t is then characterized by the number of defects n out of the total number of sites N, which defines a defect fraction x = n/N. However, because the creation and annihilation of defects is a stochastic process, we describe the state of the sample by the probability P(n|t) of having n defect sites at time t. Alternatively, we can use the fraction of defects x.
III. DISCUSSION
In the following, we explore our model by varying its free parameters to understand how they affect the predicted number of defects in the material and how they are related to the IDF F. Varying the power flux Q and the material temperature β, we estimate the fraction of defects that can be formed for different exposure times t. We explore the limitations and range of applicability of our model.
A. Numerical exploration of model
In
![]()
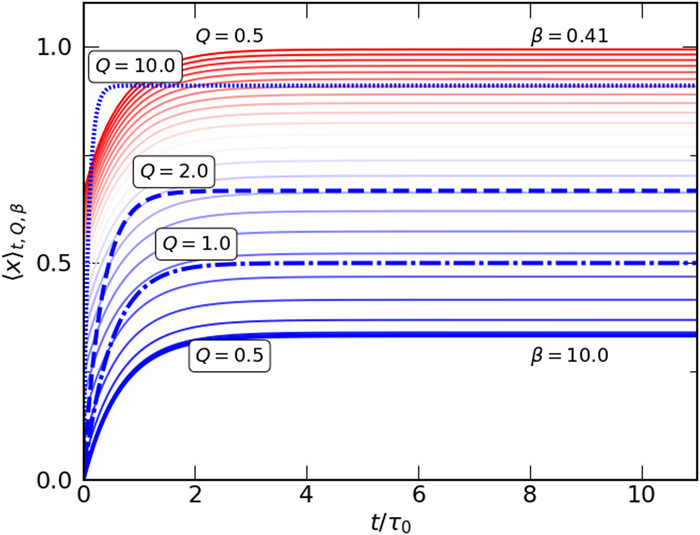
Figure 1.Evolution of average fraction of defects, given by
When the temperature is increased for a given power flux (e.g., Q = 0.5 Q0 in
In previous work,
![]()
Figure 2.Average fraction of defects for
In
![]()
Figure 3.Asymptotic values
In a recently published article,
B. Damage factor F
In the quest for a single descriptor for estimating the degree of material damage in different irradiation experiments, the IDF (sometimes known as the heat flux factor) defined by
From the observation that the same microstructural damage is observed for a given F in different experiments, we begin by testing the hypothesis that the average fraction of defects
To explore the model in terms of the IDF F, we consider isolines of fixed
![]()
Figure 4.Average fraction of defects as a function of exposure time for different values of integral damage factor (IDF)
![]()
Figure 5.Maximum fraction of defects as a function of IDF
Moreover, for F/F0 ≪ 1, this maximum fraction of defects is linear with F, as shown in
![]()
Figure 6.Maximum fraction of defects as a function of normalized IDF
In other words,
![]()
Figure 7.Maximum effective temperature as a function of IDF, computed by matching
We can also associate an arbitrary fraction of defects with an effective temperature through
![]()
Figure 8.Effective temperature
IV. CONCLUSIONS
We have developed a simple model for the kinetics of the fraction of defects as a function of the input power flux Q and the exposure time t. The model considers the creation of defects due to the incident radiation and also their recombination due to thermal mobility. Interestingly, the model is irrespective of irradiation type (e.g., electrons, ions, plasma shocks, heat flux, electromagnetic radiation, laser light), depending on only the energy of defect formation and not on the specific type of defect. In this way, we obtained a formula [Eq.
We predict that for any given power flux, the material reaches a steady state after a long exposure time, where the fraction of defects stays constant, because of the equilibrium between the creation and recombination of defects. As the material temperature increases, the material reaches a new steady state with more defects. The number of defects that our model predicts is consistent with observations of melting in PF experiments for the same power flux and exposure time, in terms of the expected fraction of defects for melting to occur.
According to the assumptions of our model, the maximum fraction of defects increases as the IDF increases, and the dependence is roughly linear below F/F0 ∼ 0.1, which means that the creation of defects is not as efficient for high values of IDF. Of course, xmax cannot increase indefinitely, so we may consider that our model is no longer valid above some threshold of defect concentration. Above this threshold, our model breaks down and a different phenomenology, other than defect formation, must be considered.
The description of the IDF from this model supports the observations from experiments of various types with different types of radiation and wide ranges of values for the power flux and irradiation time. More interestingly, it also supports the use of table-top PF devices to test candidate plasma-facing materials under the conditions expected in nuclear fusion reactors. In this way, it is possible to perform these tests in small-scale laboratories, including table-top experiments, which was previously possible only in large experimental facilities.
We also acknowledge that our model does not include other type of defects, such as divacancies or clusters of vacancies, dislocations, or the effect of grain boundaries. However, it constitutes a starting point that allows us to understand the connection between atomic processes and macroscopic measurements of damage induced by radiation in the context of plasma-facing materials, as well as the physical meaning of the IDF descriptor.
APPENDIX A: FIRST MOMENT OF ADVECTION EQUATION
We begin with the one-dimensional continuity equation for a random variable
APPENDIX B: NONLINEAR MODEL
We take the average fraction of defects in Eq.
References
[1] V. A. Gribkov, O. A. Kost, M. A. Orlova et al. Enzyme activation and inactivation induced by low doses of irradiation. Appl. Biochem. Biotechnol., 88, 243-255(2000).
[2] S. C. Bott, D. M. Haas, J. Kim et al. Supersonic jet formation and propagation in x-pinches. Astrophys. Space Sci., 336, 33-40(2011).
[3] I. V. Borovitskaya, E. V. Demina, V. A. Gribkov et al. Application of dense plasma focus devices and lasers in the radiation material sciences for the goals of inertial fusion beyond ignition. Matter Radiat. Extremes, 5, 045403(2020).
[4] R. Gonzalez-Arrabal, J. M. Perlado, A. Rivera. Limitations for tungsten as plasma facing material in the diverse scenarios of the European inertial confinement fusion facility HiPER: Current status and new approaches. Matter Radiat. Extremes, 5, 055201(2020).
[5] Y. Li, M. P. Short, Y. Yang et al. Ion radiation albedo effect: Influence of surface roughness on ion implantation and sputtering of materials. Nucl. Fusion, 57, 016038(2017).
[6] G. Cheng, W. Xu, Y. Zhang et al. In-situ atomic-scale observation of irradiation-induced void formation. Nat. Commun., 4, 2288(2013).
[7] E. Artacho, M. T. Dove, K. Trachenko et al. Atomistic simulations of resistance to amorphization by radiation damage. Phys. Rev. B, 73, 174207(2006).
[8] E. Bringa, E. Figueroa, G. Gutiérrez, D. Tramontina. Mechanical properties of irradiated nanowires—A molecular dynamics study. J. Nucl. Mater., 467, 677-682(2015).
[9] R. G. Hoagland, B. P. Uberuaga, S. M. Valone, A. F. Voter. Direct transformation of vacancy voids to stacking fault tetrahedra. Phys. Rev. Lett., 99, 135501(2007).
[10] G. S. Was. Fundamentals of Radiation Materials Science(2017).
[11] B. Verberck. Building the way to fusion energy. Nat. Phys., 12, 395-397(2016).
[12] E. I. Moses. Advances in inertial confinement fusion at the National Ignition Facility (NIF). Fusion Eng. Des., 85, 983-986(2010).
[13] D. A. Callahan, D. T. Casey, O. A. Hurricane et al. Fuel gain exceeding unity in an inertially confined fusion implosion. Nature, 506, 343-348(2014).
[14] A. W. Leonard. Edge-localized-modes in tokamaks. Phys. Plasmas, 21, 090501(2014).
[15] J. N. Brooks, G. Federici, C. H. Skinner et al. Plasma-material interactions in current tokamaks and their implications for next step fusion reactors. Nucl. Fusion, 41, 1967(2001).
[16] J. Alvarez, R. González-Arrabal, A. Rivera et al. Potential common radiation problems for components and diagnostics in future magnetic and inertial confinement fusion devices. Fusion Eng. Des., 86, 1762-1765(2011).
[17] M. Fujitsuka, H. Shinno, H. Shiraishi, T. Tanabe. Thermal shock experiments for carbon materials by electron beams. J. Nucl. Mater., 179-181, 189-192(1991).
[18] F. Escourbiac, J. Linke, I. V. Mazul et al. High heat flux testing of plasma facing materials and components—Status and perspectives for iter related activities. J. Nucl. Matter, 367, 1422-1431(2007).
[19] T. Barashkova, T. Laas, V. Pelõhh. Methods for estimating the damage factor of materials under the influence of plasma, 22-24(2010).
[20] B. Bienkowska, M. Borowiecki, V. A. Gribkov et al. Plasma dynamics in PF-1000 device under full-scale energy storage: I. Pinch dynamics, shock-wave diffraction, and inertial electrode. J. Phys. D: Appl. Phys., 40, 1977-1989(2007).
[21] L. I. Ivanov, S. A. Maslyaev, V. N. Pimenov et al. Surface and bulk processes in materials induced by pulsed ion and plasma beams at dense plasma focus devices. Nukleonika, 51, 71-78(2006).
[22] E. V. Demina, S. A. Maslyaev, V. N. Pimenov et al. Damage and modification of materials produced by pulsed ion and plasma streams in dense plasma focus device. Nukleonika, 53, 111-121(2008).
[23] J. Moreno, C. Pavez, L. Soto et al. Characterization of the axial plasma shock in a table top plasma focus after the pinch and its possible application to testing materials for fusion reactors. Phys. Plasmas, 21, 122703(2014).
[24] A. N. Bandura, O. V. Byrka, I. E. Garkusha et al. Damage to preheated tungsten targets after multiple plasma impacts simulating iter elms. J. Nucl. Mater., 386, 127-131(2009).
[25] V. A. Gribkov, L. I. Ivanov, V. N. Pimenov et al. Interaction of high temperature deuterium plasma streams and fast ion beams with stainless steels in dense plasma focus device. J. Phys. D: Appl. Phys., 36, 1817(2003).
[26] A. Ainsaar, T. Laas, V. Shirokova et al. Comparison of damages in tungsten and tungsten doped with lanthanum-oxide exposed to dense deuterium plasma shots. J. Nucl. Matter, 435, 181-188(2013).
[27] M. J. Inestrosa-Izurieta, E. Ramos-Moore, L. Soto. Morphological and structural effects on tungsten targets produced by fusion plasma pulses from a table top plasma focus. Nucl. Fusion, 55, 093011(2015).
[28] S. Lee, A. Serban. Dimensions and lifetime of the plasma focus pinch. IEEE Trans. Plasma Sci., 24, 1101-1105(1996).
[29] W. Kies, J. Moreno, P. Silva, L. Soto. Pinch evidence in a fast and small plasma focus of only tens of joules. Plasma Sources Sci. Technol., 13, 329(2004).
[30] L. Soto. New trends and future perspectives on plasma focus research. Plasma Phys. Controlled Fusion, 47, A361(2005).
[31] C. Pavez, L. Soto, A. Tarifeño et al. Studies on scalability and scaling laws for the plasma focus: Similarities and differences in devices from 1 MJ to 0.1 J. Plasma Sources Sci. Technol., 19, 055017(2010).
[32] J. Moreno, P. Silva, L. Soto et al. Neutron emission from a fast plasma focus of 400 Joules. Appl. Phys. Lett., 83, 3269-3271(2003).
[33] M. Milanese, R. Moroso, J. Pouzo. DD neutron yield in the 125 J dense plasma focus nanofocus. Eur. Phys. J. D, 27, 77-81(2003).
[34] P. Lee, R. S. Rawat, R. Verma et al. Experimental study of neutron emission characteristics in a compact sub-kilojoule range miniature plasma focus device. Plasma Phys. Controlled Fusion, 51, 075008(2009).
[35] C. Pavez, J. Pedreros, M. Zambra et al. Potentiality of a small and fast dense plasma focus as hard x-ray source for radiographic applications. Plasma Phys. Controlled Fusion, 54, 105018(2012).
[36] J. L. Ellsworth, S. Falabella, V. Tang et al. Design and initial results from a kilojoule level dense plasma focus with hollow anode and cylindrically symmetric gas puff. Rev. Sci. Instrum., 85, 013504(2014).
[37] H. Acuña, M. Barbaglia, H. Bruzzone et al. Experimental study of the hard x-ray emissions in a plasma focus of hundreds of joules. Plasma Phys. Controlled Fusion, 51, 045001(2009).
[38] J. Moreno, P. Silva, L. Soto et al. A plasma focus driven by a capacitor bank of tens of joules. Rev. Sci. Instrum., 73, 2583-2587(2002).
[39] Y. Kobayashi, S. R. Mohanty, T. Sakamoto et al. Miniature hybrid plasma focus extreme ultraviolet source driven by 10 kA fast current pulse. Rev. Sci. Instrum., 77, 043506(2006).
[40] J. Moreno, P. Silva, L. Soto et al. Demonstration of neutron production in a table-top pinch plasma focus device operating at only tens of joules. J. Phys. D: Appl. Phys., 41, 205215(2008).
[41] P. Lee, R. S. Rawat, R. Verma et al. Miniature plasma focus device as a compact hard x-ray source for fast radiography applications. IEEE Trans. Plasma Sci., 38, 652-657(2010).
[42] P. Banerjee, S. K. Sharma, R. Shukla et al. Low voltage operation of plasma focus. Rev. Sci. Instrum., 81, 083501(2010).
[43] B. L. Bures, C. James, M. Krishnan. A plasma focus electronic neutron generator. IEEE Trans. Plasma Sci., 40, 1082-1088(2012).
[44] L. Soto, A. Tarifeño-Saldivia. Statistical characterization of the reproducibility of neutron emission of small plasma focus devices. Phys. Plasmas, 19, 092512(2012).
[45] P. Mishra, R. Niranjan, R. K. Rout et al. Palm top plasma focus device as a portable pulsed neutron source. Rev. Sci. Instrum., 84, 063503(2013).
[46] J. Moreno, C. Pavez, L. Soto et al. Nanofocus: An ultra-miniature dense pinch plasma focus device with submillimetric anode operating at 0.1 J. Plasma Sources Sci. Technol., 18, 015007(2008).
[47] C. Pavez, L. Soto. Demonstration of x-ray emission from an ultraminiature pinch plasma focus discharge operating at 0.1 J nanofocus. IEEE Trans. Plasma Sci., 38, 1132-1135(2010).
[48] H. N. Acuña, M. O. Barbaglia, H. Bruzzone et al. Electrical behavior of an ultralow-energy plasma-focus device. IEEE Trans. Plasma Sci., 42, 138-142(2014).
[49] J. Moreno, C. Pavéz, L. Soto et al. Evidence of nuclear fusion neutrons in an extremely small plasma focus device operating at 0.1 Joules. Phys. Plasmas, 24, 082703(2017).
[50] S. Davis, C. Pavez, L. Soto et al. Material studies for inertial fusion devices using pulsed plasma shocks from a repetitive table top plasma focus device, 187-203(2019).
[51] R. Zwanzig. Nonequilibrium Statistical Mechanics(2001).
[52] N. G. Van Kampen. Stochastic Processes in Physics and Chemistry(2007).
[53] T. S. Noggle, O. S. Oen. Reduction in radiation damage due to channeling of 51-MeV iodine ions in gold. Phys. Rev. Lett., 16, 395(1966).
[54] M. Hillert. Phase Equilibria, Phase Diagrams and Phase Transformations(2007).
[55] A. B. Belonoshko, S. Davis, B. Johansson, A. Rosengren. Model for diffusion at the microcanonical superheating limit from atomistic computer simulations. Phys. Rev. B, 84, 064102(2011).
[56] J. Fikar, R. Schäublin. Molecular dynamics simulation of radiation damage in bcc tungsten. J. Nucl. Matter, 386, 97-101(2009).
[57] K. Nordlund, A. E. Sand, S. J. Zinkle et al. Primary radiation damage: A review of current understanding and models. J. Nucl. Matter, 512, 450-479(2018).
[58] R. W. Balluffi, R. O. Simmons. Measurement of equilibrium concentrations of vacancies in copper. Phys. Rev., 129, 1533(1963).
[59] S. Davis, J. Peralta, M. J. Pozo. Statistical distribution of thermal vacancies close to the melting point. Physica A, 457, 310-313(2015).
[60] R. A. Konchakov, Y. P. Mitrofanov, E. V. Safonova et al. Experimental evidence for thermal generation of interstitials in a metallic crystal near the melting temperature. J. Phys.: Condens. Matter, 28, 215401(2016).
[61] V. I. Dubinko, K. Schwartz, M. V. Sorokin et al. Kinetics of lattice defects induced in lithium fluoride crystals during irradiation with swift ions at room temperature. Nucl. Instrum. Methods Phys. Res., Sect. B, 466, 17-19(2020).
[62] V. Kashcheyevs, E. A. Kotomin, V. N. Kuzovkov et al. Modeling of primary defect aggregation in tracks of swift heavy ions in LiF. Phys. Rev. B, 64, 144108(2001).
[63] C.-C. Fu, J. D. Torre, F. Willaime et al. Multiscale modelling of defect kinetics in irradiated iron. Nat. Mater., 4, 68-74(2004).
[64] G. De Temmerman, R. P. Doerner, J. H. Yu et al. The effect of transient temporal pulse shape on surface temperature and tungsten damage. Nucl. Fusion, 55, 093027(2015).
[65] T. W. Morgan, H. J. Van Der Meiden, G. G. Van Eden et al. The effect of high-flux H plasma exposure with simultaneous transient heat loads on tungsten surface damage and power handling. Nucl. Fusion, 54, 123010(2014).
[66] D. Garoz, A. R. Páramo, A. Rivera et al. Modelling the thermomechanical behaviour of the tungsten first wall in HiPER laser fusion scenarios. Nucl. Fusion, 56, 126014(2016).


Set citation alerts for the article
Please enter your email address

© Copyright 2018-2021 | Chinese Laser Press. All Rights Reserved 沪ICP备15018463号-20