
Guoqiang Li, Runze Lin, Haichao Guo, Pengfei Tian, Nan Chi. Visible light communication system at 3.59 Gbit/s based on c-plane green micro-LED[J]. Chinese Optics Letters, 2022, 20(11): 110602
- Chinese Optics Letters
- Vol. 20, Issue 11, 110602 (2022)
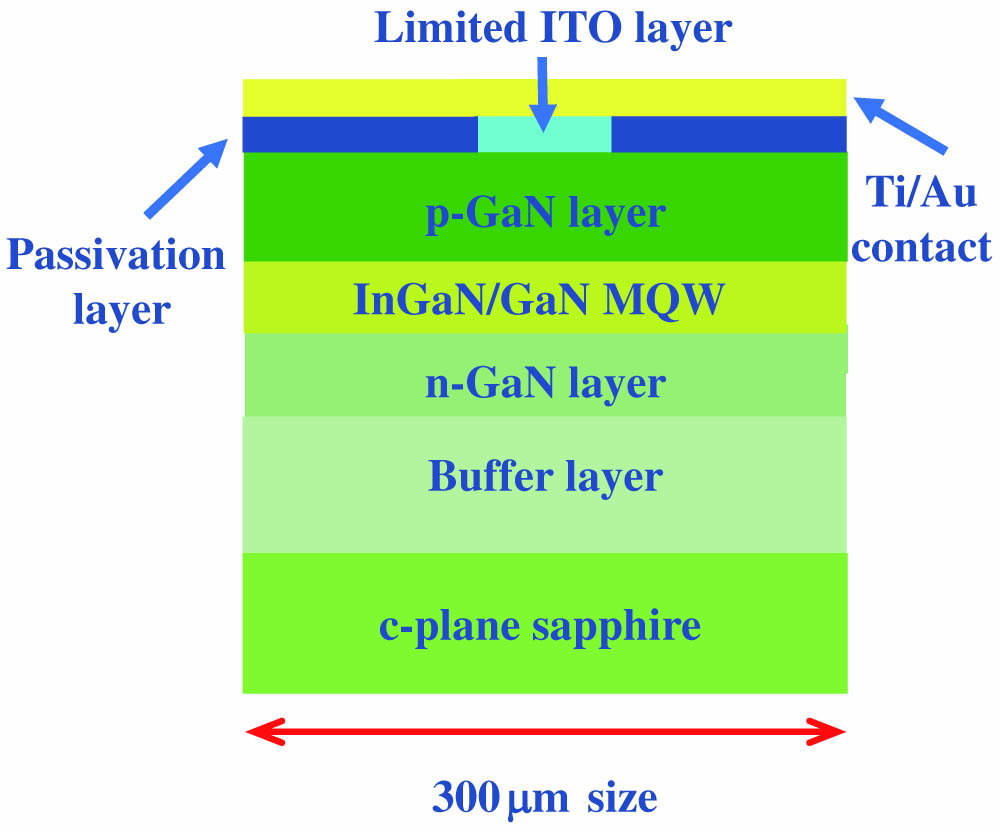
Fig. 1. Schematic structure of multi-functional green micro-LED.
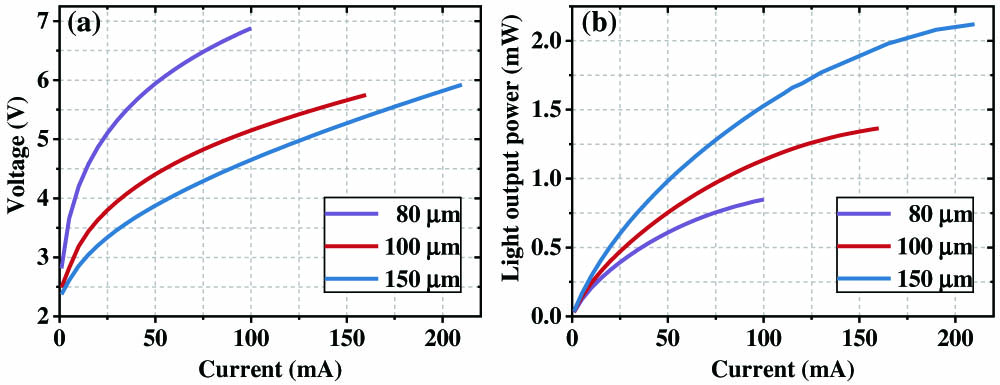
Fig. 2. (a) I-V curves and (b) P-I curves of multi-functional green micro-LEDs with different sizes.
Fig. 3. (a) Frequency response curves of the 100 µm micro-LED at different current densities. (b) Modulation bandwidth versus current density curves of 80, 100, and 150 µm devices, respectively.
Fig. 4. EL spectra characteristics of 100 µm micro-LED. (a) Spectra at different currents. (b) Peak wavelength and (c) FWHM versus current curves.
Fig. 5. Experimental setup of the micro-LED-based VLC system. (a) Photograph of the optical system showing the micro-LED, lens group, and APD. Micrographs of three different sizes of micro-LEDs: (b) 80 µm; (c) 100 µm; (d) 150 µm.
Fig. 6. Measured data rates for (a) different driven current with Vpp = 0.8 V, (b) different signal Vpp with optimal bias current (90 mA, 150 mA, and 180 mA for 80, 100, and 150 µm devices, respectively).
Fig. 7. Measured data rates of 100 µm micro-LED without pre-equalization, with partial or full equalization for (a) different driven current and (b) different signal Vpp.
Fig. 8. Frequency spectrum comparison of transmitted signal and received signal: (a) without pre-equalization; (b) with partial pre-equalization; (c) with full pre-equalization.
Fig. 9. (a) Measured data rates and (b) BERs for different signal bandwidths. (c) SNR versus subcarrier index at the signal bandwidth of 750 MHz.
Fig. 10. (a) QAM order and SNR versus subcarrier index of 100 µm micro-LEDs at the highest data rate. (b) Corresponding constellation diagrams.

Set citation alerts for the article
Please enter your email address
© Copyright 2018-2021 | Chinese Laser Press. All Rights Reserved 沪ICP备15018463号-20