• High Power Laser Science and Engineering
  • Vol. 10, Issue 6, 06000e43 (2022)
Jingui Ma1, Xiaoping Ouyang2、*, Liangze Pan2, Peng Yuan1, Dongfang Zhang1, Jing Wang1, Guoqiang Xie1, Jianqiang Zhu2, and Liejia Qian1、3
Author Affiliations
  • 1Key Laboratory for Laser Plasmas (MOE), Collaborative Innovation Center of IFSA, School of Physics and Astronomy, Shanghai Jiao Tong University, Shanghai, China
  • 2Joint Laboratory of High Power Laser and Physics, Shanghai Institute of Optics and Fine Mechanics, Chinese Academy of Sciences, Shanghai, China
  • 3Tsung-Dao Lee Institute, Shanghai Jiao Tong University, Shanghai, China
  • show less
    DOI: 10.1017/hpl.2022.28 Cite this Article Set citation alerts
    Jingui Ma, Xiaoping Ouyang, Liangze Pan, Peng Yuan, Dongfang Zhang, Jing Wang, Guoqiang Xie, Jianqiang Zhu, Liejia Qian. Large temporal window and high-resolution single-shot cross-correlator with two separate measurement channels[J]. High Power Laser Science and Engineering, 2022, 10(6): 06000e43 Copy Citation Text show less
    Principle and design of the TC-SSCC. (a) Schematic diagram for the temporal window of the THG-based SSCC (top view). The correlating pulse, intersecting with the under-test pulse, sampling pulse and optical axis by angles α, β and θ, respectively, is emitted perpendicularly to the crystal surface and is received by an N-pixel detector. PFT (PFS), pulse front of the under-test (sampling) pulse. (b) Schematic diagram for temporal resolution of the THG-based SSCC (top view). (c) ((d)) Calculated noncollinear angle α+β (blue), temporal window (black) and temporal resolution (red) as a function of angle θ under Type-I (Type-II) PM conditions in β-BBO crystals. The under-test and sampling pulses are at 800 and 400 nm, respectively. The two dashed lines in (c) mark the working points of the two channels of the TC-SSCC in the experiments.
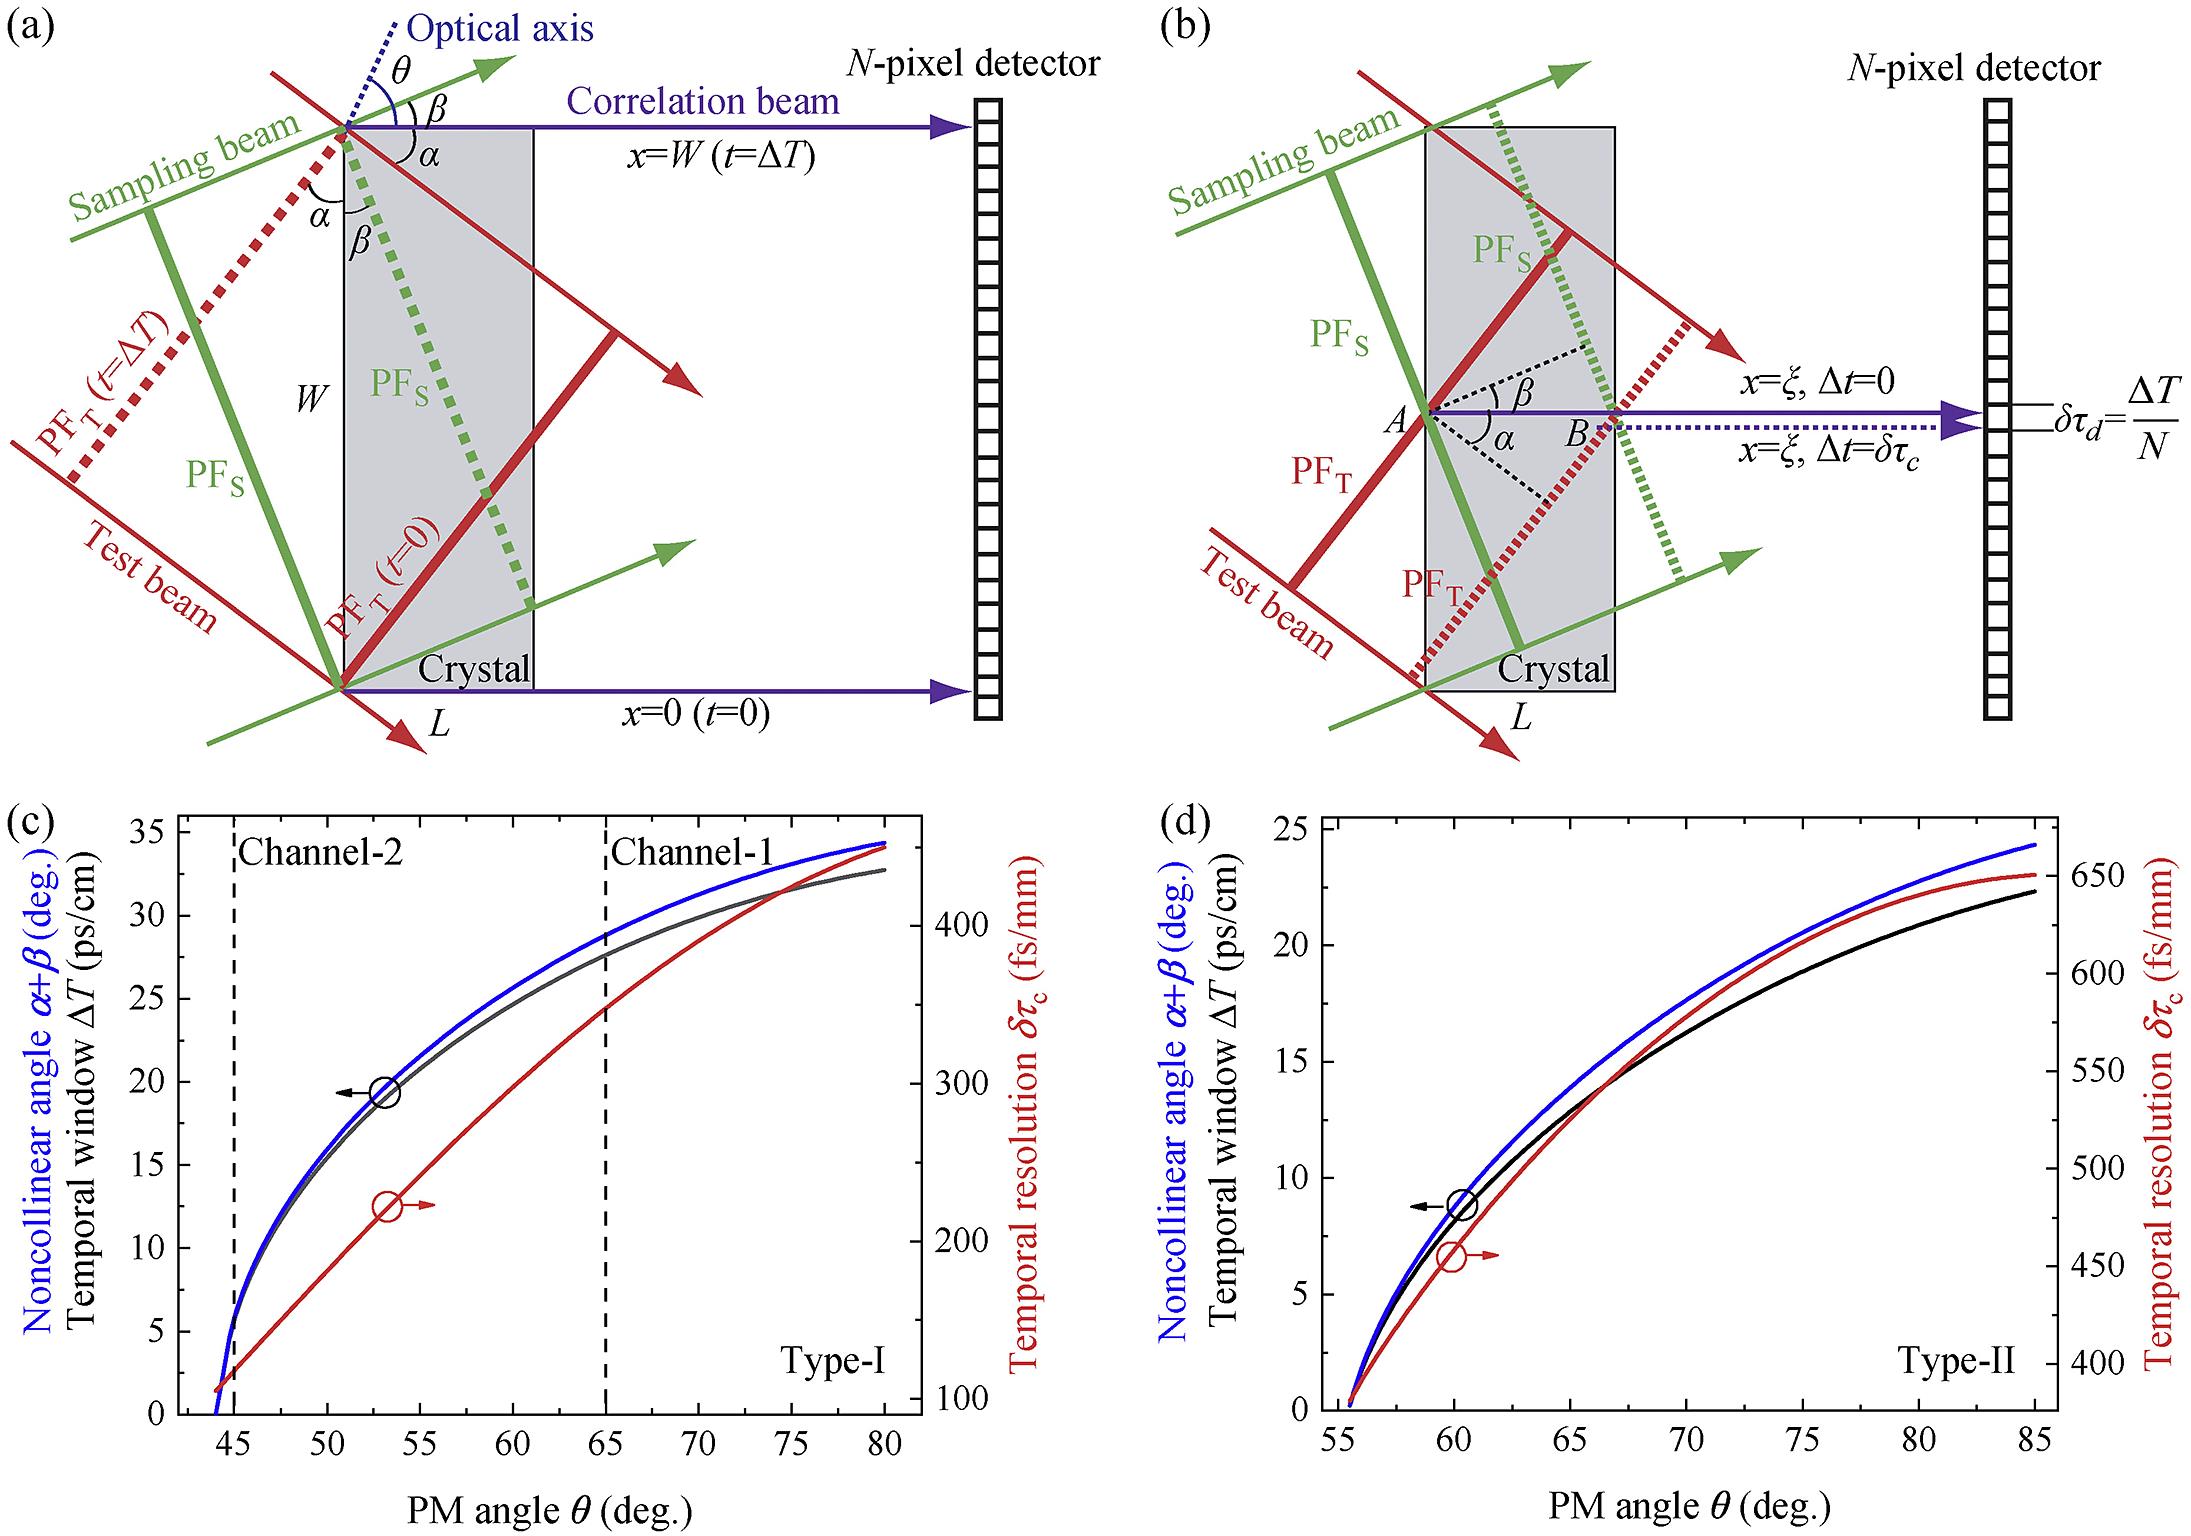
    Fig. 1. Principle and design of the TC-SSCC. (a) Schematic diagram for the temporal window of the THG-based SSCC (top view). The correlating pulse, intersecting with the under-test pulse, sampling pulse and optical axis by angles α, β and θ, respectively, is emitted perpendicularly to the crystal surface and is received by an N-pixel detector. PFT (PFS), pulse front of the under-test (sampling) pulse. (b) Schematic diagram for temporal resolution of the THG-based SSCC (top view). (c) ((d)) Calculated noncollinear angle α+β (blue), temporal window (black) and temporal resolution (red) as a function of angle θ under Type-I (Type-II) PM conditions in β-BBO crystals. The under-test and sampling pulses are at 800 and 400 nm, respectively. The two dashed lines in (c) mark the working points of the two channels of the TC-SSCC in the experiments.
    Schematic diagram of the TC–SSCC. DM, dichroic mirror, high reflection at 400 nm and high transmission at 800 nm; BS-1, beam splitter for 800 nm; BS-2, beam splitter for 400 nm; HWP, half-wave plate; HR, high reflection mirror for 800 nm; CLA, cylindrical lens assembly for beam shaping; Ag, silver mirrors; Au, gold mirrors; Al, aluminum mirrors; TS, translation stage; CL1 (CL3), cylindrical lens with f = 100 mm for imaging; CL2 (CL4), cylindrical lens with f = 30 mm for focusing; FA, fiber array with N = 100 channels; PMT, photomultiplier tube. Insets, beam profiles of FH under-test pulses before BS1 and SH sampling pulses before BS2.
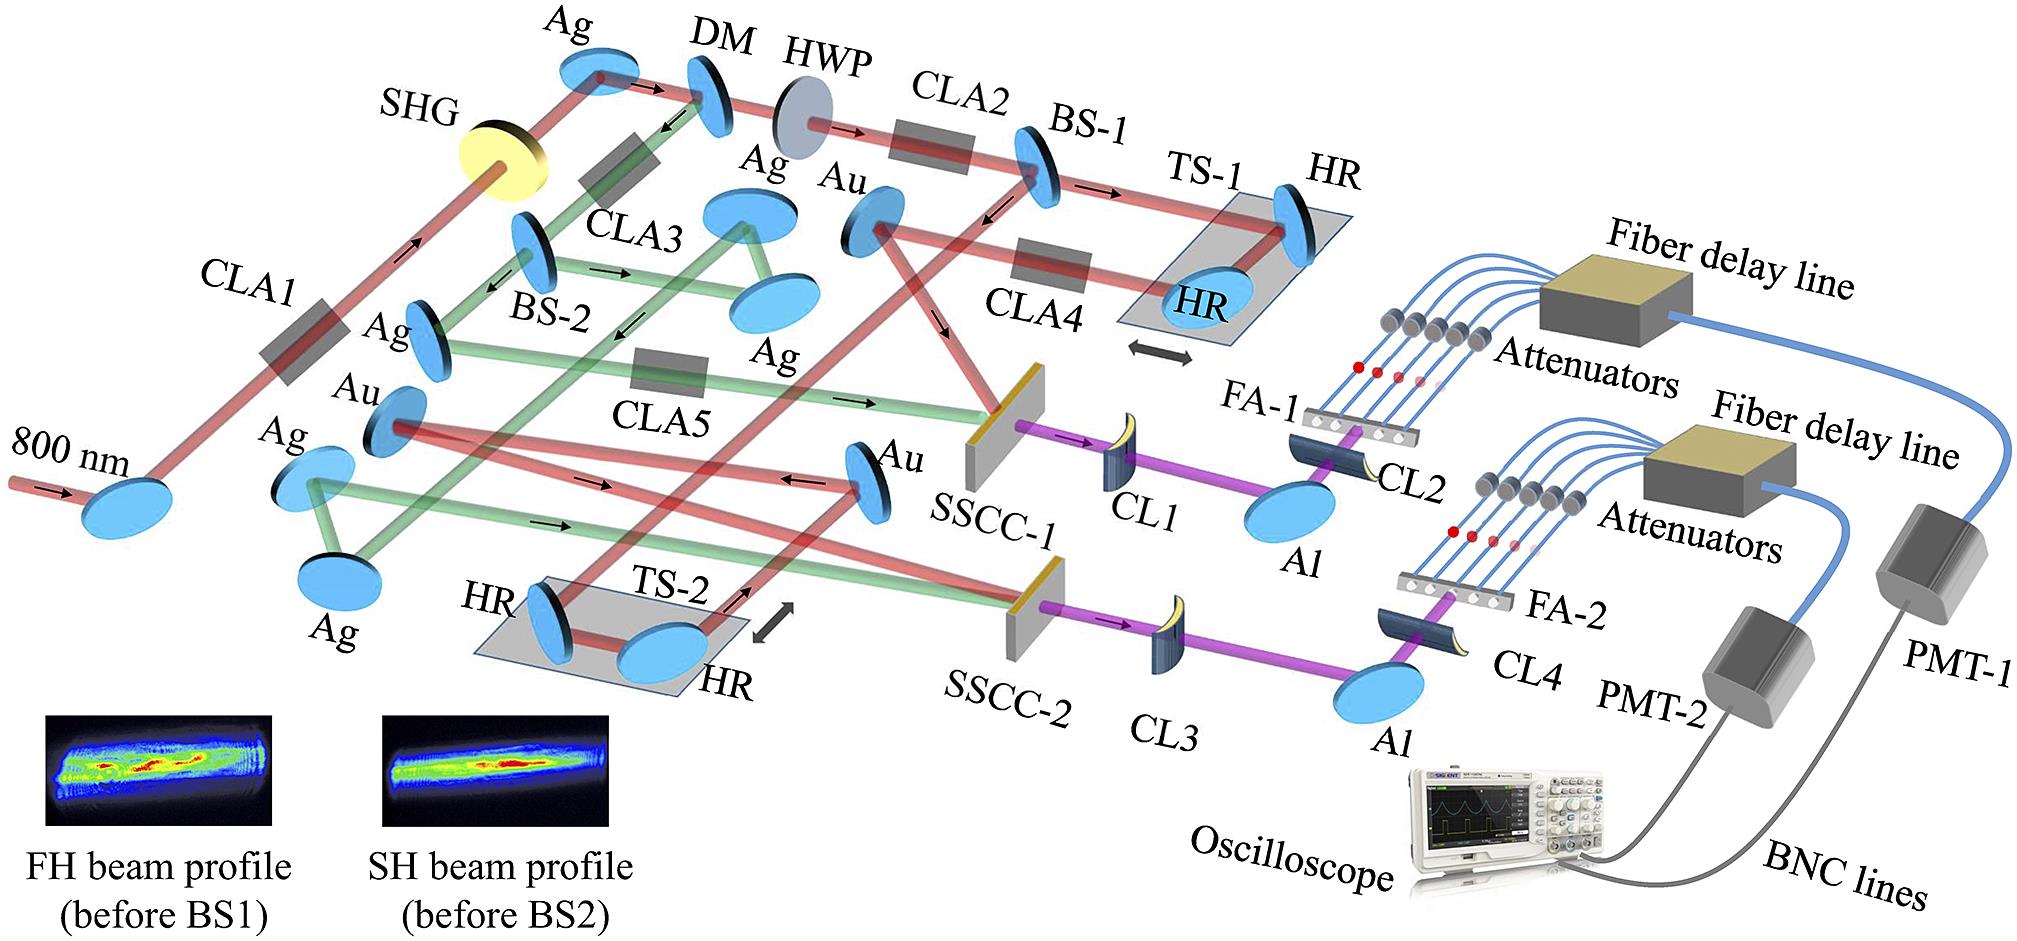
    Fig. 2. Schematic diagram of the TC–SSCC. DM, dichroic mirror, high reflection at 400 nm and high transmission at 800 nm; BS-1, beam splitter for 800 nm; BS-2, beam splitter for 400 nm; HWP, half-wave plate; HR, high reflection mirror for 800 nm; CLA, cylindrical lens assembly for beam shaping; Ag, silver mirrors; Au, gold mirrors; Al, aluminum mirrors; TS, translation stage; CL1 (CL3), cylindrical lens with f = 100 mm for imaging; CL2 (CL4), cylindrical lens with f = 30 mm for focusing; FA, fiber array with N = 100 channels; PMT, photomultiplier tube. Insets, beam profiles of FH under-test pulses before BS1 and SH sampling pulses before BS2.
    Temporal resolution characterization for the TC–SSCC. (a) Measured peak pulse by a DSCC (black), and channel-1 (blue) and channel-2 (red) of the TC–SSCC. (b) High-dynamic-range measurements on the peak pulse by a DSCC (black) and channel-2 of the TC–SSCC (red). The DSCC adopted a 25-fs scanning step.
    Fig. 3. Temporal resolution characterization for the TC–SSCC. (a) Measured peak pulse by a DSCC (black), and channel-1 (blue) and channel-2 (red) of the TC–SSCC. (b) High-dynamic-range measurements on the peak pulse by a DSCC (black) and channel-2 of the TC–SSCC (red). The DSCC adopted a 25-fs scanning step.
    Large-window pulse-contrast measurement by channel-1 of the TC-SSCC (red curve with circles). Blue curve with circles, measurement by channel-1 of the TC-SSCC when the back-surface-wedged BS-2 was replaced by a 4-mm-thick non-wedged splitter. Green squares, expected prepulse locations caused by the non-wedged splitter. Black curve, DSCC measurement with a scanning step of 1 ps.
    Fig. 4. Large-window pulse-contrast measurement by channel-1 of the TC-SSCC (red curve with circles). Blue curve with circles, measurement by channel-1 of the TC-SSCC when the back-surface-wedged BS-2 was replaced by a 4-mm-thick non-wedged splitter. Green squares, expected prepulse locations caused by the non-wedged splitter. Black curve, DSCC measurement with a scanning step of 1 ps.
    Combination of two-channel measurements. Blue curve with circles, channel-2 measurement; red curve with circles, channel-1 measurement from –108 to –3 ps with a wedged BS-2; purple curve with circles, channel-1 measurement from –130 to –25 ps with a non-wedged BS-2; green squares, expected prepulse locations caused by the non-wedged splitter; black solid curve, DSCC measurement with a scanning step of 200 fs; black dashed line, minimum display of the oscilloscope.
    Fig. 5. Combination of two-channel measurements. Blue curve with circles, channel-2 measurement; red curve with circles, channel-1 measurement from –108 to –3 ps with a wedged BS-2; purple curve with circles, channel-1 measurement from –130 to –25 ps with a non-wedged BS-2; green squares, expected prepulse locations caused by the non-wedged splitter; black solid curve, DSCC measurement with a scanning step of 200 fs; black dashed line, minimum display of the oscilloscope.
    The TC-SSCC prototype device for the SG-II 5 PW laser. (a) Device photograph, uncovered side panels. (b) Data processing system, consisting of an oscilloscope and an analysis software.
    Fig. 6. The TC-SSCC prototype device for the SG-II 5 PW laser. (a) Device photograph, uncovered side panels. (b) Data processing system, consisting of an oscilloscope and an analysis software.
    InstitutionWindowResolutionDynamic rangeTechnical characteristic
    iTEOX, France[25]18 ps0.018 ps108Self-referenced spectral interferometry
    RAL, UK[26]36 ps0.09 psThird-order cross-correlation
    SIOM, CAS[27]65 ps0.16 ps1011Fourth-order auto-correlation
    Fudan & SJTU[28]70 ps0.9 ps109High-order quasi-phase-matching cross-correlation
    XIOPM, CAS[29]42.9 ps1.95 ps106Optical Kerr gate
    LANL, USA[30]50 ps4 ps107Tilted pulse front
    Rochester, USA[31]200 ps6.26 ps106Optical pulse replicator
    This work114 ps0.2 ps109aThird-order cross-correlation with two separate channels
    Table 1. Technical parameters and characteristics of existing SSCC devices.
    Jingui Ma, Xiaoping Ouyang, Liangze Pan, Peng Yuan, Dongfang Zhang, Jing Wang, Guoqiang Xie, Jianqiang Zhu, Liejia Qian. Large temporal window and high-resolution single-shot cross-correlator with two separate measurement channels[J]. High Power Laser Science and Engineering, 2022, 10(6): 06000e43
    Download Citation