
Jingui Ma, Xiaoping Ouyang, Liangze Pan, Peng Yuan, Dongfang Zhang, Jing Wang, Guoqiang Xie, Jianqiang Zhu, Liejia Qian, "Large temporal window and high-resolution single-shot cross-correlator with two separate measurement channels," High Power Laser Sci. Eng. 10, 06000e43 (2022)
- High Power Laser Science and Engineering
- Vol. 10, Issue 6, 06000e43 (2022)
Abstract
1
Since its invention in 1960, the laser has become a helpful tool in various fields, including scientific research, industry and medical treatments. The major of the parameters of a laser of concern for applications are its wavelength, power, energy, pulse duration, spectral width, repetition rate, beam quality M2 factor and so on. Besides these parameters, for intense lasers with peak powers beyond 100 TW, the laser parameter of pulse contrast, that is, the intensity ratio between the pulse peak and noise pedestal, is also of importance[1−7]. During chirped-pulse amplification for intense pulses, undesired noise arises and is amplified as well[8−16]. Once the noise intensity in the leading edge of the pulse peak exceeds the ionization threshold (~1011 W/cm2), the noise will destroy the target before the arrival of the pulse peak and severely degrade high-field physical experiments[17−19]. To ensure a clean laser–plasma interaction by the peak pulse, the noise intensity must be controlled below the ionization threshold; in other words, the pulse contrast must be high enough and also needs to be further enhanced as the laser power increases. For example, current petawatt-class lasers with intensities of approximately 1021−1022 W/cm2 need high contrast ratios of at least 1010−1011[4−6].
The characterization of pulse contrast is a prerequisite to trace the noise and improve the pulse contrast. Cross-correlation is widely adopted in pulse-contrast measurement, where the temporal intensity profile of the under-test pulse is probed by a clean sampling pulse (e.g., the second harmonic of the under-test pulse). Currently, the delay-scanning cross-correlator (DSCC) is commercially available and has been the workhorse used to measure the pulse contrasts of high repetition-rate lasers and the repetitive front-ends of petawatt lasers[20−22]. However, to characterize the pulse contrast at the final end of petawatt lasers that usually operate in a single-shot mode (the time intervals of pulses are typically several tens of minutes), a single-shot cross-correlator (SSCC) is a must for an image of a pulse contrast in a single exposure[23,24]. Furthermore, the SSCC measurement is also necessary even for repetitive lasers because the laser noise varies from one pulse shot to the next, while the DSCC measurement can only give an average result of repetitive detections that may deviate from the real pulse contrast to some degree. Several SSCC devices have been developed[25−31], and their technical parameters and characteristics are listed in Table 1. Now, the state-of-the-art SSCC device has a dynamic range as high as 1013 [32] and, hence, is capable of contrast measurement for current PW lasers and future 200 PW lasers.
| Institution | Window | Resolution | Dynamic range | Technical characteristic |
|---|---|---|---|---|
| iTEOX, France[ | 18 ps | 0.018 ps | 108 | Self-referenced spectral interferometry |
| RAL, UK[ | 36 ps | 0.09 ps | – | Third-order cross-correlation |
| SIOM, CAS[ | 65 ps | 0.16 ps | 1011 | Fourth-order auto-correlation |
| Fudan & SJTU[ | 70 ps | 0.9 ps | 109 | High-order quasi-phase-matching cross-correlation |
| XIOPM, CAS | 42.9 ps | 1.95 ps | 106 | Optical Kerr gate |
| LANL, USA | 50 ps | 4 ps | 107 | Tilted pulse front |
| Rochester, USA | 200 ps | 6.26 ps | 106 | Optical pulse replicator |
| This work | 114 ps | 0.2 ps | 109a | Third-order cross-correlation with two separate channels |
Table 1. Technical parameters and characteristics of existing SSCC devices.
It is also desirable for an SSCC device to have both a large temporal window and a high temporal resolution. A temporal window larger than 50 ps is usually required, and the larger the better. At the same time, a resolution from 0.1 to 1 ps is necessary (depending on the under-test pulse duration) to distinguish the peak pulse. However, the increase in the temporal window will inevitably degrade the temporal resolution due to the inherent trade-off between them (Table 1)[24,28]. For example, a 200 ps temporal window was obtained by a pulse-replicator-based SSCC, but the temporal resolution was limited to only 6.26 ps[31]. On the other hand, a high temporal resolution is attainable only in a small temporal window. For a spectral-interferometry-based SSCC, the temporal resolution was as high as 18 fs but the temporal window was only 18 ps[25]. All these works clearly manifest the trade-off between the temporal window and the resolution.
Sign up for High Power Laser Science and Engineering TOC. Get the latest issue of High Power Laser Science and Engineering delivered right to you!Sign up now
To circumvent such a trade-off, here we propose the idea of a two-channel SSCC (TC-SSCC) for separately achieving a large temporal window and a high resolution. The idea of the TC-SSCC works by the fact that the pulse peak and noise pedestal have distinct temporal characteristics. The measurement for the pulse peak and coherent noise within typically the ±10 ps range indeed needs a high resolution[10–16]. In comparison, the measurement for the incoherent noise pedestal (e.g., amplified spontaneous emission) calls for a large temporal window but without the need for a high resolution[8,9]. In our TC-SSCC design, channel-1 for the incoherent noise measurement has a large temporal window of 105 ps but a moderate resolution of approximately 1.3 ps, while channel-2 for the pulse peak measurement has a high resolution of approximately 200 fs and a moderate window of approximately 12 ps. Although the limitation still exists in each channel, the effect of the two-channel measurement breaks the trade-off and is equivalent to an SSCC with both a large temporal window of approximately 114 ps and a high resolution of approximately 200 fs. In this paper, we will first introduce the design principle of the TC-SSCC, then present the experimental results on the temporal resolution and window, and finally discuss the development of a TC-SSCC prototype for the SG-II 5 PW laser[33,34].
2
It is difficult to measure the pulse contrast directly in the time domain due to the limited rise time of photodetectors. The SSCC usually relies on time-to-space encoding that converts the temporal contrast of the under-test pulse into the spatial contrast of the correlating beam. The spatially distributed correlating beam can be measured by a parallel array detector, such as a charge-coupled device (CCD)[24–27,29–31] or a fiber-array (FA)-mediated photomultiplier[23,28,32]. Time-to-space encoding can be enabled by using a clean sampling pulse to interact with the under-test pulse in a wide-beam noncollinear geometry. The sampling pulse should have higher pulse contrast than the under-test pulse, which can be generated by under-test pulse pumped second-harmonic generation (SHG)[24–26,30–32], optical parametric amplification (OPA)[28] and four-wave mixing[27]. The generated sampling pulse interacts with the under-test pulse in a nonlinear crystal, where sum-frequency generation (SFG)[24–28,31,32] or different-frequency generation (DFG)[30] is commonly used to generate the correlating beam that carries the contrast information of the under-test pulse. To facilitate online application in practical petawatt-class lasers, the SSCC device should have easy accessibility and high stability. Thus, our TC-SSCC device adopts an SHG process for generating the sampling pulse and an SFG process for generating the correlating beam. Because the intersection angle between the two lower frequency waves is the largest in the vector triangle of phase-matching (PM), the SFG correlation typically allows a larger noncollinear angle between the under-test and sampling waves, compared with the DFG correlation. Therefore, the SFG correlation supports a larger temporal window. In addition, the SFG signal will not be affected by the parametric fluorescence and optical scattering of incident waves, and hence the measurement based on the SFG correlation is clean and truly represents the under-test pulse.
Figure 1(a) shows a schematic of the TC-SSCC based on third-order harmonic generation (THG). A nonlinear crystal cut at angle θ with the optical axis has a transverse width W and a longitudinal thickness L. The under-test and the sampling beams are incident upon the crystal from the same side by the angles α and β to the normal, respectively. Both beams are assumed to be uniform in the transverse direction and wide enough to fully cover the crystal, and their noncollinear SFG enables time-to-space encoding and creates a single-shot temporal window ΔT, which can be calculated according to the geometric relations in Figure 1(a) as follows:
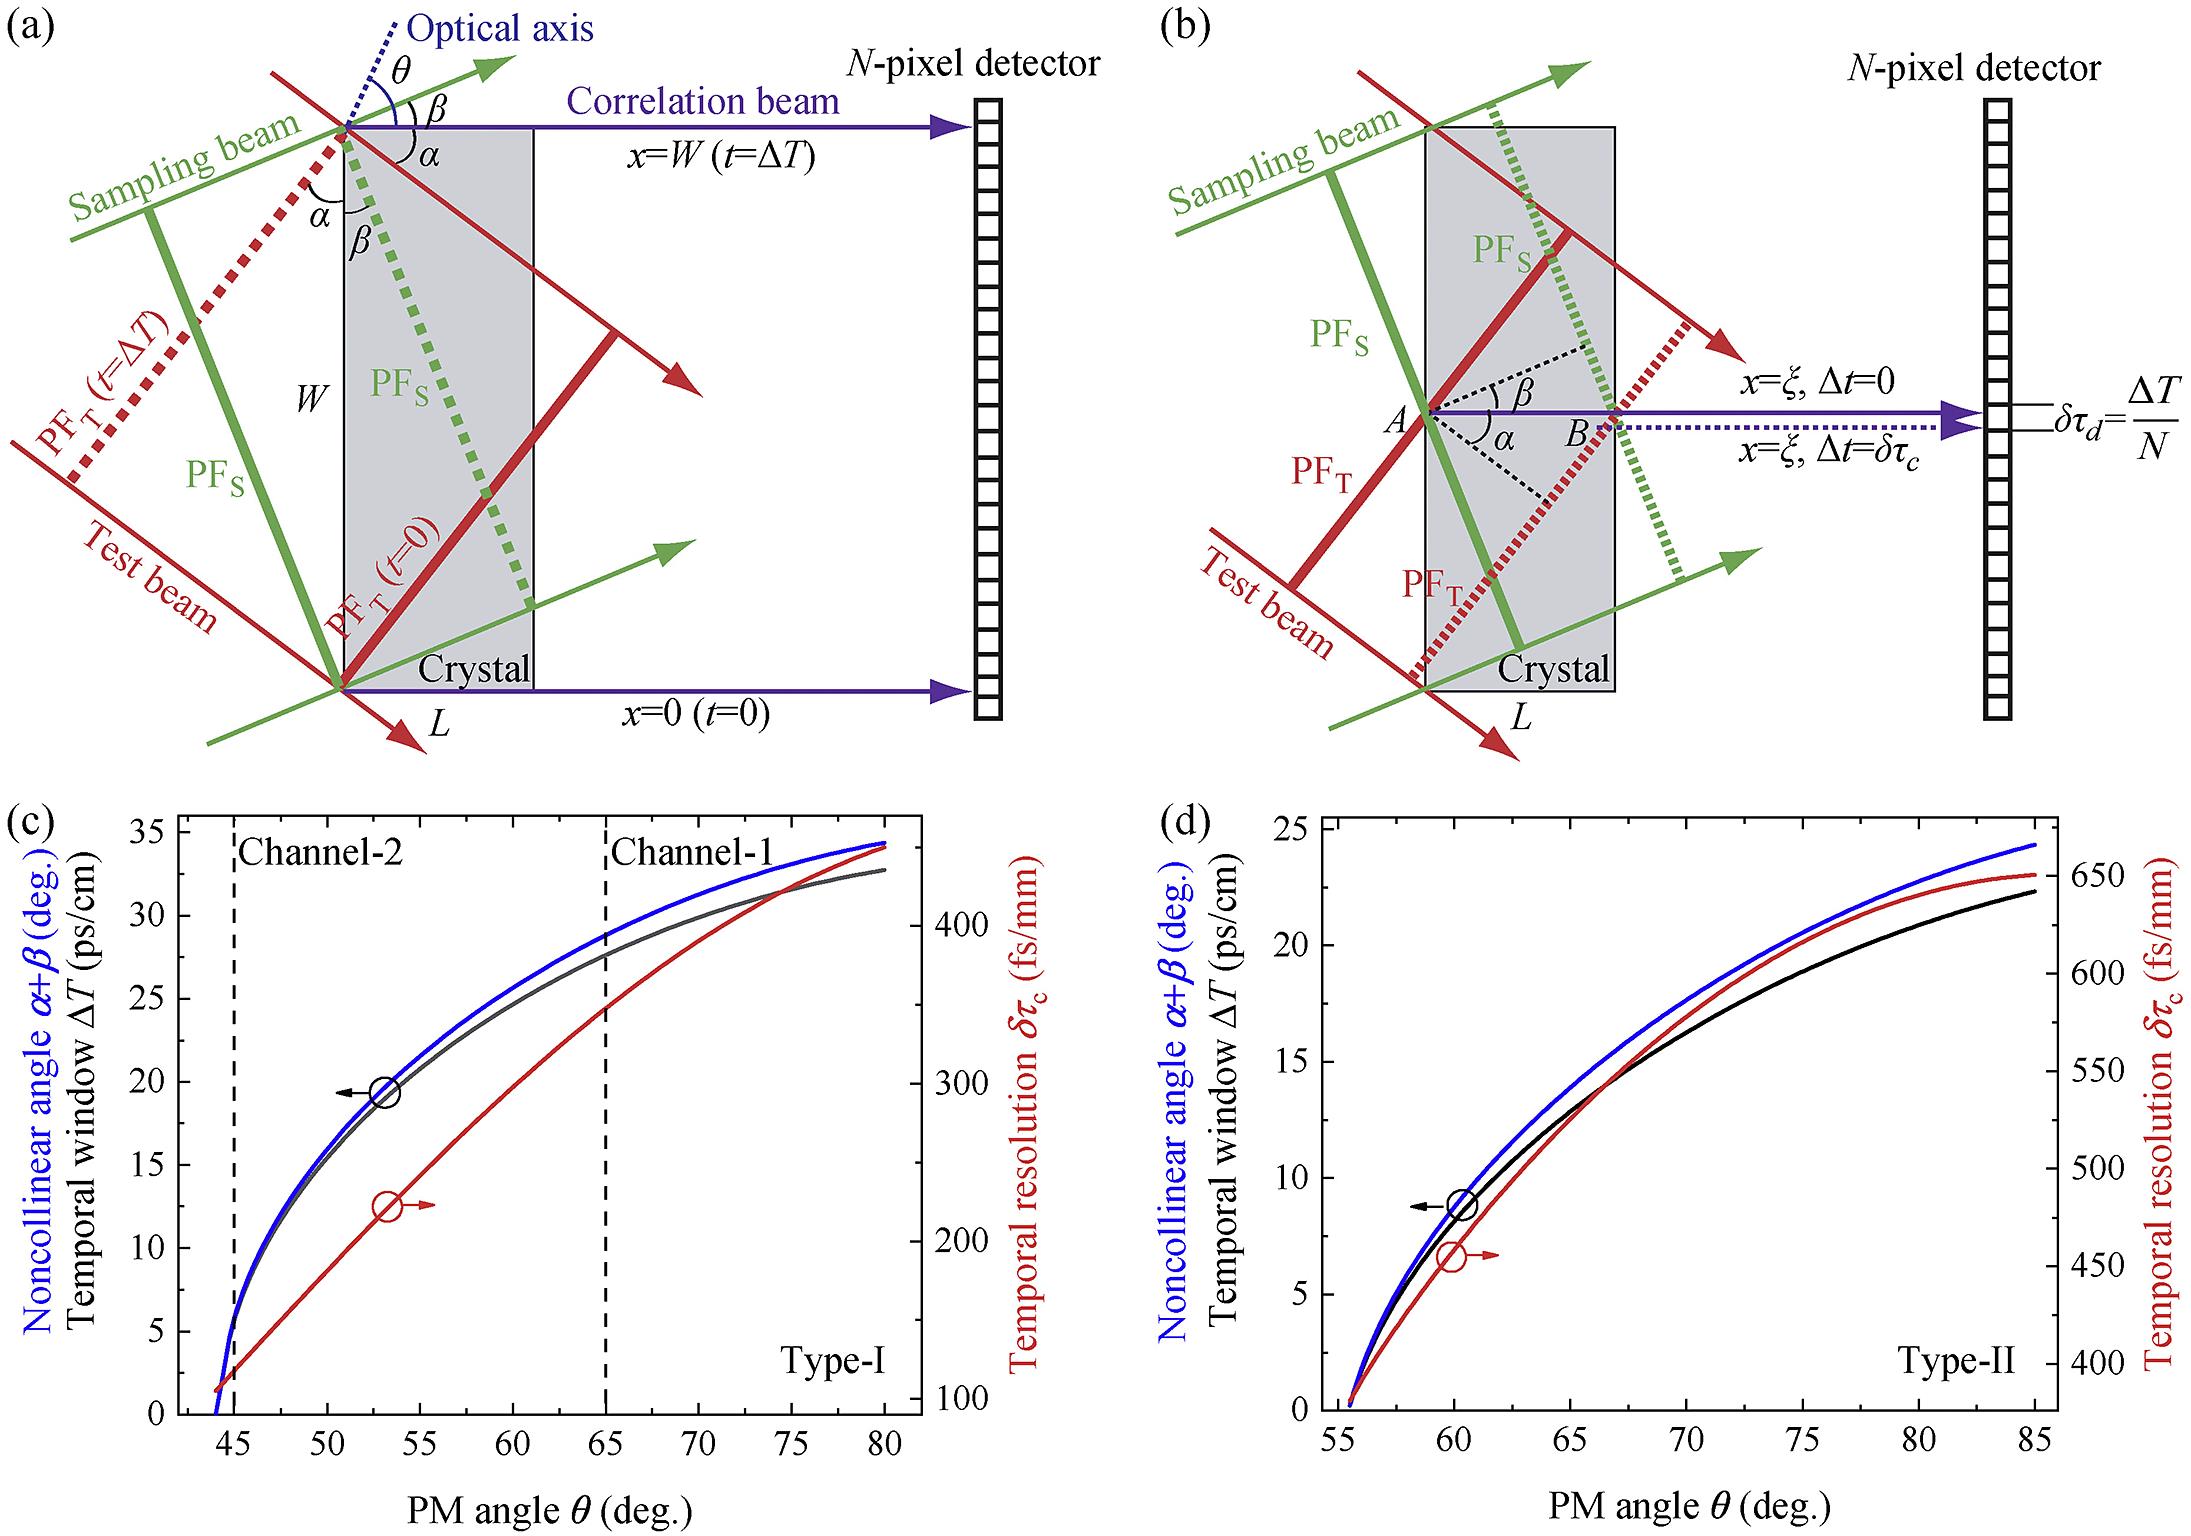
Figure 1.Principle and design of the TC-SSCC. (a) Schematic diagram for the temporal window of the THG-based SSCC (top view). The correlating pulse, intersecting with the under-test pulse, sampling pulse and optical axis by angles
where nT (nS) is the refractive index of the under-test (sampling) pulse. The generated correlating beam propagates along the normal direction of the crystal for avoiding artifacts caused by the surface reflection[35], which is then imaged onto an array detector with N pixels. The pixel number (N) of the detector determines a temporal resolution δτd = ΔT/N. Although the commonly used CCD and complementary metal oxide semiconductor (CMOS) detectors can support a high pixel resolution, an FA-mediated photomultiplier system of N = 100 pixels (pixel size 125 μm) is used here for achieving a high dynamic range by the single-photon detection sensitivity.
In addition to the limited pixels of the detector, the temporal resolution is also limited by the cross-correlation process. Ideal time-to-space encoding requires a one-to-one correspondence between the time t and the transverse location x. However, as the nonlinear crystal has a finite thickness L, the ideal time-to-space encoding is strictly satisfied only on the input surface and then blurred by propagating through the crystal. As shown in Figure 1(b), when the under-test and sampling pulse fronts arrive at the point A (x = ξ) at the same time (Δt = 0), they produce the correlating signal that is emitted from the crystal at point B. Ideally, the intensity of this correlating beam AB at x = ξ only corresponds to the correlating signal at Δt = 0. However, the correlating beam also has the contributions of the correlation at Δt ≠ 0. According to Figure 1(b), the maximum time ambiguity in time-to-space encoding is defined as follows:
According to Equations (1) and (2), we calculated the temporal window ΔT and the resolution δτc for 800 nm under-test pulses in various nonlinear crystals of β-BBO, KDP, KBBF, CLBO and LBO. We find that the β-BBO crystal is the best choice for achieving large ΔT because of the simultaneous large noncollinear angle and large available crystal size. Figures 1(c) and 1(d) present the noncollinear angle α+β (blue), temporal window ΔT (black) and resolution δτc (red ) as a function of the PM angle θ in β-BBO crystals under the PM conditions of both Type-I [800 nm (o) + 400 nm (o) → 266 nm (e)] and Type-II [800 nm (e) + 400 nm (o) → 266 nm (e)], in which ΔT is the value for W = 1 cm, while δτc is the value for L = 1 mm. The Type-I PM can support a larger temporal window and a higher temporal resolution, which is thereby applied by the TC-SSCC device.
Our TC-SSCC design relies on the fact that the temporal window increases and the temporal resolution decreases with the increase of angle θ [Figure 1(c)]. Although a larger PM angle θ corresponds to a larger temporal window, the large-window channel (channel-1) of the TC-SSCC is designed to work at a moderate θ of 65° to have a sufficient nonlinear coefficient. At θ = 65°, ΔT is 27.5 ps/cm and δτc is 350 fs/mm. The temporal window can be as large as 110 ps with a commercially available β-BBO crystal of size 40 mm (W) × 10 mm (H) × 2 mm (L) (LNG Optics, China). In this case, the resolutions δτc and δτd are calculated as 700 fs and 1.1 ps, respectively, rendering the total resolution δτ = 1.3 ps for an under-test pulse of τ = 35 fs typically. Different from the large-window channel, the small-window channel (channel-2) of the TC-SSCC works at θ = 45° for achieving a high temporal resolution, under which ΔT = 6 ps/cm and δτc = 120 fs/mm. By using a β-BBO crystal of 25 mm (W) × 10 mm (H) × 1 mm (L), the temporal window ΔT is 15 ps and the temporal resolution δτ is 200 fs, which can be deduced from δτc = 120 fs and δτd = 150 fs.
3 Experiments and results
3.1 TC-SSCC setup
Figure 2 shows the schematic setup of the TC-SSCC that aims for the contrast measurement of 800 nm pulses. The horizontally polarized under-test pulses from a femtosecond Ti:sapphire regenerative amplifier system (Astrella, Coherent) were firstly beam expanded by two times in the horizontal direction by a cylindrical lens assembly (CLA-1), and then were frequency doubled with a 20 mm × 20 mm × 1 mm β-BBO crystal cut at θ = 29.2° with anti-reflection coatings for both 800 and 400 nm wavelengths. The left-hand fundamental-harmonic (FH) pulses and the generated second-harmonic (SH) pulses were split by a dichroic mirror (USB21, Thorlabs). The SH pulses were split into two beams by a beamsplitter with a reflection ratio of approximately 15% (BSS16, Thorlabs), which were guided to the first and the second SSCC channels, respectively, serving as the sampling beams. The FH pulses passed through a half-wave plate for polarization rotation by 90°, and then were split into two parts by a beamsplitter with a reflection ratio of approximately 18% (BSN17, Thorlabs). The reflected and transmitted parts of the FH pulses were guided to the first and the second SSCC channels, respectively, serving as the under-test beams. Time delays between corresponding FH and SH pulses on correlation crystals were tuned by two translation stages placed in the FH paths.
![]()
Figure 2.Schematic diagram of the TC–SSCC. DM, dichroic mirror, high reflection at 400 nm and high transmission at 800 nm; BS-1, beam splitter for 800 nm; BS-2, beam splitter for 400 nm; HWP, half-wave plate; HR, high reflection mirror for 800 nm; CLA, cylindrical lens assembly for beam shaping; Ag, silver mirrors; Au, gold mirrors; Al, aluminum mirrors; TS, translation stage; CL1 (CL3), cylindrical lens with
In the TC-SSCC device, the two correlation channels adopted β-BBO crystals with different sizes and PM angles: 40 mm (W) × 10 mm (H) × 2 mm (L) and θ = 65° for channel-1, and 25 mm (W) × 10 mm (H) × 1 mm (L) and θ = 45° for channel-2. To ensure uniform beam profiles across the full apertures of correlation crystals, both the FH and SH beams were expanded by two times in the horizontal direction by cylindrical lens assemblies (CLA-2 and CLA-3) before beam splitting, and the FH and SH beams in channel-1 were further expanded by two times by cylindrical lens assemblies (CLA-4 and CLA-5) before making the cross-correlation. The generated third-harmonic (TH) signals in the two channels were horizontally imaged (by cylindrical lenses CL1 and CL3) and vertically coupled (by cylindrical lenses CL2 and CL4) onto two FAs (the width of each array is 12.5 mm), respectively. The TH beam was converted into 100 serial sub-beams by the FA and sequent fiber delay line (provided by CeramOptec), and finally detected by a photomultiplier tube (PMT; H10721-113, Hamamatsu). Two bandpass filters were placed before the PMT to filter out the scatterings from the FH and SH beams. The two PMT detectors in the two measurement channels were identical, and their outputs were analyzed by an oscilloscope. To match the dynamic range of the PMTs (~105), adequate attenuation is needed for each fiber according to the pulse intensities therein. At the beginning of online testing, several laser shots were needed for setting the attenuation step by step with the aid of external filters before the FA (see Section 4.2 in Ma et al.[23] for details). With adequate attenuation, the correlation signal can be set to approximately 3×10² photons with a resolution of nearly a single photon. Notably, the easily accessed fiber attenuation is another advantage of the FA-based detection system. By comparison, it is very difficult to attenuate each pixel without the impairment of nearby pixels in a traditional CCD detector.
We briefly discuss the dynamic range of a single pixel. The minimum TH intensity of correlation that can be resolved by a pixel is limited by the single-photon detection of the PMT. The maximum TH intensity of correlation in a pixel is set by the crystal damage caused by FH or SH beams. The TH ratio of the upper and lower limits determines the highest dynamic range, which can reach 1013 in principle, as demonstrated by Ma et al.[32]. However, the apparent dynamic range in a practical measurement depends on the available input power onto the TC-SSCC. In this proof-of-principle experiment, the apparent dynamic range of the device was approximately 109 due to the limited input energy of 4.4 mJ. Since the THG correlation is a cubic function of input energy, a dynamic range of approximately 1013 can be anticipated if high input energy of approximately 100 mJ is available.
Perfect time-to-space encoding in noncollinear cross-correlation requires uniform intensity profiles for both under-test and sampling beams. Considering that a completely uniform beam was difficult to achieve in practice, the under-test beam in our design adopted the residual FH beam after SHG. In principle, this can produce complementary profiles between the under-test and sampling beams and thereby ensure a relatively uniform cross-correlation response across the direction of wide beams. The measured under-test and sampling beam profiles are shown in the insets of Figure 2. To check the effect of such beam profiles on measurements, we shifted the generated TH pulse peak into different fiber pixels by tuning the translation stage in each channel (TS-1 or TS-2) and obtained a peak-to-valley ratio of less than 2. The shot-to-shot fluctuations on beam intensities during the measurements were suppressed by stabilizing the Ti:sapphire laser output and averaging the results of multiple laser shots. This small response variation of 2× caused by beam nonuniformity should be acceptable for the high-dynamic-range measurement.
3.2 Experimental results
We first evaluated the temporal resolutions for the two channels of the TC-SSCC. Conventional DSCC measurements with a 25-fs scanning precision were given for comparison (Sequoia, Amplitude Technologies). Figure 3(a) summarizes the measurement results for the peak pulse in a linear intensity scale. The pulse recorded by channel-2 of the TC-SSCC [red circles in Figure 3(a)] was nearly identical to the DSCC measurement [black circles in Figure 3(a)]. By comparison, the channel-1 measurement manifested a poor resolution for the peak pulse [blue circles in Figure 3(a)]. Obviously, channel-2 had a higher resolution than channel-1, which agreed with the design. As another indicator for the high resolution, channel-2 correctly resolved the fine structures around the peak pulse in a high dynamic range, consistent with the DSCC results, as shown in Figure 3(b). Due to the unexpected high loss in the last 17 fiber channels in FA-2, the correlating lights in these channels were not recorded in the experiments. As a result, the valid temporal window was approximately 12 ps for channel-2 of the TC-SSCC.
![]()
Figure 3.Temporal resolution characterization for the TC–SSCC. (a) Measured peak pulse by a DSCC (black), and channel-1 (blue) and channel-2 (red) of the TC–SSCC. (b) High-dynamic-range measurements on the peak pulse by a DSCC (black) and channel-2 of the TC–SSCC (red). The DSCC adopted a 25-fs scanning step.
Next, we studied the large window of channel-1 in the TC-SSCC device. As introduced in Section3.1, a 40-mm-wide β-BBO crystal was applied to conduct the cross-correlation in channel-1, which supported a single-shot temporal window of 110 ps. The measurements in a window of approximately 105 ps are summarized in Figure 4. To observe more leading edge of the peak pulse, the time delay of the window was purposely set to (–95 ps, +10 ps) by tuning the translation stage TS-1. The experimentally measured window was slightly smaller than the design value because only approximately 38 mm crystal width was effectively illuminated by the under-test and sampling pulses. Meanwhile, the DSCC measurement result with a scanning step of 1 ps was also given as a reference (black curve in Figure 4). The pulse pedestal measured by the TC-SSCC (red circles in Figure 4) was comparable to that by the DSCC. Note that there was a strong prepulse at –37 ps on the DSCC trace but none on the SSCC trace. Such a prepulse was introduced by a 4-mm-thick beamsplitter, which split only 10% of the Astrella output for the DSCC. The Fresnel reflection between the two surfaces of this non-wedged beamsplitter introduced a postpulse at +37 ps on the under-test pulse. After SHG, a postpulse at +37 ps appeared on the sampling pulse, which finally translated to a prepulse at –37 ps on the DSCC trace. Similarly, the prepulse at –23 ps on the SSCC trace was identified as an artifact caused by Fresnel reflection between the two surfaces of the 2-mm-thick cross-correlation crystal.
![]()
Figure 4.Large-window pulse-contrast measurement by channel-1 of the TC-SSCC (red curve with circles). Blue curve with circles, measurement by channel-1 of the TC-SSCC when the back-surface-wedged BS-2 was replaced by a 4-mm-thick non-wedged splitter. Green squares, expected prepulse locations caused by the non-wedged splitter. Black curve, DSCC measurement with a scanning step of 1 ps.
The channel-1 measurements were further verified by measuring predetermined prepulses (blue circles in Figure 4). In the standard version of the TC-SSCC, the beamsplitters on the FH and SH arms had wedged surfaces to avoid contamination by beam deflection. To introduce some artifact prepulses, the beamsplitter in the SH arm (BS-2 in Figure 2) was replaced by a 4-mm-thick non-wedged splitter with a rated reflection ratio of approximately 30% on the front surface and a rated transmission ratio of more than 98% on the back surface. The Fresnel reflection between two surfaces of this non-wedged plate would generate a series of postpulses on the SH sampling pulses, which would convert to prepulses on the TH correlating pulses. The intensity contrast and temporal locations of these prepulses could be well determined by the reflection ratio and thickness of this plate (green squares in Figures 4 and 5). As expected, there appeared two prepulses on the channel-1 measurement, as shown by the blue circles in Figure 4. The intensity contrast and temporal locations of these prepulses agreed well with the calculation. Such a measurement proved the precision of our SSCC. The prepulses at –17.7, –56 and –61.5 ps on the blue trace and those at –44.5 and –70 ps on the red trace were caused by nonlinear interaction between the splitter-induced postpulses of the sampling pulse and the postpulses of the under-test pulse.
![]()
Figure 5.Combination of two-channel measurements. Blue curve with circles, channel-2 measurement; red curve with circles, channel-1 measurement from –108 to –3 ps with a wedged BS-2; purple curve with circles, channel-1 measurement from –130 to –25 ps with a non-wedged BS-2; green squares, expected prepulse locations caused by the non-wedged splitter; black solid curve, DSCC measurement with a scanning step of 200 fs; black dashed line, minimum display of the oscilloscope.
In the TC-SSCC device, the channel-1 and channel-2 measurements could be plotted together to form a larger temporal window. Channel-2 was responsible for measuring the peak pulse (blue circles in Figure 5), while channel-1 was devoted to measuring the noise pedestal by moving the main pulse out of its own window (red circles in Figure 5). The temporally accessible delay of channel-1 was determined by the moving amount of translation stage TS-1. The key issue was the calibration of the two-channel measurements. The absolute intensity of channel-1 could be normalized to the peak of channel-2 by multiplying a calibration coefficient, which was determined by their responses to the peak pulse. This calibration coefficient was set to approximately 1 by controlling the energy division between the two channels. As shown in Figure 5, the combination of the two-channel measurements gave a full measurement on pulse contrast from –108 to 6 ps. The good agreement between the two-channel measurements in the approximately 3 ps overlap region (from –6 to –3 ps) verified the above data calibration procedure. This calibration method was important for the case in which there was no overlap between the two-channel measurement. Such two-channel arrangement brought several advantages to the TC-SSCC measurements. Firstly, the channel-1 measurements were normalized to the peak pulse given by the channel-2 measurement, which can overcome the underestimation of the main-pulse intensity by the low-resolution channel-1. As a result, the noise pedestal in channel-1 was lower than that plotted in Figure 4 but agreed well with the DSCC measurement with a higher resolution of 200 fs. Secondly, the time delay of the channel window could be adjusted. For example, we shifted the channel-1 window to cover the delay range from –130 to –25 ps (purple circles in Figure 5), and observed three artifact prepulses caused by Fresnel reflection of the non-wedged beamsplitter (BS-2). Thirdly, there was no peak pulse in the temporal window of channel-1, which could avoid scattering contamination from the peak pulse and benefit high-dynamic-range measurements[35].
We developed a prototype TC-SSCC device for the SG-II 5 PW Ti:sapphire laser[33,34], as shown in Figure 6(a). The device had a size of 1000 mm × 700 mm × 400 mm. The elevated two black modules in the photograph were the packaged fiber delay lines, on which there were 200 fibers. The SG-II 5 PW laser had a full beam aperture of approximately 290 mm. To measure the laser parameters (not only the pulse contrast, but also the pulse duration and spectrum, etc.), approximately 4% of the energy of the full-size beam was sampled by a splitter and then telescoped into a beam size of approximately 32 mm. Such an under-test beam was further telescoped to match our TC-SSCC device. The beam paths within the device are schematically plotted in Figure 2. Although the temporal window in channel-1 could exceed 100 ps as demonstrated above, the window in the device was reserved to approximately 65 ps ruled by the technical service order. The following modifications were made to channel-1: a 25-mm-wide β-BBO correlation crystal was used rather than the 40-mm-wide crystal used in the above experiments; the lens assemblies (CLA-4 and CLA-5) were removed; the imaging ratio from the correlation signal to the FA was changed to 2:1. The reduced temporal window allows the temporal resolution to be increased to approximately 1 ps for channel-1. Channel-2 remains the same as the proof-of-principle experiments and thus offers a high temporal resolution of approximately 200 fs. Therefore, the TC-SSCC prototype combines a temporal window of approximately 75 ps and a high resolution of 200 fs. Such a performance is difficult to achieve with a traditional single-channel SSCC. To facilitate the operation of the TC-SSCC device, we developed a data processing system, consisting of an oscilloscope (PXIe-5160, NI) and an analysis software written in LabVIEW, as shown in Figure 6(b). This system could output the measurement results for pulse contrast right after the laser shot, providing fast feedback for laser engineers and physics scientists. This TC-SSCC device has been installed in the SG-II 5-PW facility and is under test for online measurements.
![]()
Figure 6.The TC-SSCC prototype device for the SG-II 5 PW laser. (a) Device photograph, uncovered side panels. (b) Data processing system, consisting of an oscilloscope and an analysis software.
4 Conclusion
In summary, we have proposed and experimentally demonstrated a TC-SSCC device for simultaneously achieving a large temporal window and a high temporal resolution. Unlike an oscilloscope with two or more identical channels, the two channels here operated with different specifications: channel-1 with a large window but a low resolution is suitable to capture the large-scale noise pedestal, while channel-2 with a small window but a high resolution is suitable to capture the laser peak pulse. The combination of the two different channels presents a complete characterization for the pulse contrast; in particular, the high-resolution channel in the TC-SSCC allows a single-shot high-dynamic measurement on the peak pulse, which is essential for resolving the fine pulse structures and coherent noise[36]. The TC-SSCC design circumvents the trade-off between the temporal window and resolution in a conventional single-channel SSCC, and enables a large temporal window of 114 ps and a high temporal resolution of 200 fs. The apparent dynamic range of the TC-SSCC is approximately 109 in the proof-of-principle experiment, and can reach 1013 maximally by increasing the input energy[32]. The TC-SSCC integrates all the advancements in our previous works[23,28,32,35] and should be the ultimate version of a single-shot correlator with simultaneous high dynamic range, large temporal window and high resolution. A prototype TC-SSCC device has been developed for the SG-II 5 PW Ti:sapphire laser facility, which is ready for online applications. The TC-SSCC design is also suitable for contrast characterization of intense lasers at other wavelengths.
References
[1] C. N. Danson, C. Haefner, J. Bromage, T. Butcher, J-C. F. Chanteloup, E. A. Chowdhury, A. Galvanauskas, L. A. Gizzi, J. Hein, D. I. Hillier, N. W. Hopps, Y. Kato, E. A. Khazanov, R. Kodama, G. Korn, R. X. Li, Y. T. Li, J. Limpert, J. G. Ma, C. H. Nam, D. Neely, D. Papadopoulos, R. R. Penman, L. J. Qian, J. J. Rocca, A. A. Shaykin, C. W. Siders, C. Spindloe, S. Szatmári, R. M. G. M. Trines, J. Q. Zhu, P. Zhu, J. D. Zuegel. High Power Laser Sci. Eng, 7, e54(2019).
[2] A. Kessel, V. E. Leshchenko, O. Jahn, M. Krüger, A. Münzer, A. Schwarz, V. Pervak, M. Trubetskov, S. A. Trushin, F. Krausz, Z. Major, S. Karsch. Optica, 5, 434(2018).
[3] V. Bagnoud, F. Wagner. High Power Laser Sci. Eng., 4(2016).
[4] L. P. Yu, Y. Xu, S. Li, Y. Q. Liu, J. B. Hu, F. X. Wu, X. J. Yang, Z. X. Zhang, Y. F. Wu, P. L. Bai, X. L. Wang, X. M. Lu, Y. X. Leng, R. X. Li, Z. Z. Xu. Opt. Express, 27, 8683(2019).
[5] X. M. Zeng, K. N. Zhou, Y. L. Zuo, Q. H. Zhu, J. Q. Su, X. Wang, X. D. Wang, X. J. Huang, X. J. Jiang, D. B. Jiang, Y. Guo, N. Xie, S. Zhou, Z. H. Wu, J. Mu, H. Peng, F. Jing. Opt. Lett., 42, 2014(2017).
[6] Z. H. Wang, C. Liu, Z. W. Shen, Q. Zhang, H. Teng, Z. Y. Wei. Opt. Lett., 36, 3194(2011).
[7] X. P. Ouyang, Y. Cui, J. Zhu, B. Q. Zhu, J. Q. Zhu. Appl. Opt., 55, 7538(2016).
[8] C. Manzoni, J. Moses, F. X. Kärtner, G. Cerullo. Opt. Express, 19, 8357(2011).
[9] J. Itatani, J. Faure, M. Nantel, G. Mourou, S. Watanabe. Opt. Commun., 148, 70(1998).
[10] C. Hooker, Y. X. Tang, O. Chekhlov, J. Collier, E. Divall, K. Ertel, S. Hawkes, B. Parry, P. P. Rajeev. Opt. Express, 19, 2193(2011).
[11] N. Khodakovskiy, M. Kalashnikov, E. Gontier, F. Falcoz, P-M. Paul. Opt. Lett., 41, 4441(2016).
[12] J. Tan, N. Forget, A. Borot, D. Kaplan, P. Tournois, A. Muschet, L. Veisz. Opt. Express, 26, 25003(2018).
[13] N. Forget, A. Cotel, E. Brambrink, P. Audebert, C. Le Blanc, A. Jullien, O. Albert, G. Chériaux. Opt. Lett., 30, 2921(2005).
[14] D. Kaganovich, J. R. Penano, M. H. Helle, D. F. Gordon, B. Hafizi, A. Ting. Opt. Lett., 38, 3635(2013).
[15] Z. Y. Li, S. Tokita, S. Matsuo, K. Sueda, T. Kurita, T. Kawasima, N. Miyanaga. Opt. Express, 25, 21201(2017).
[16] J. G. Ma, P. Yuan, J. Wang, Y. Z. Wang, G. Q. Xie, H. Y. Zhu, L. Q. Qian. Nat. Commun., 6, 6192(2015).
[17] M. Kaluza, J. Schreiber, M. I. K. Santala, G. D. Tsakiris, K. Eidmann, J. Meyer-ter-Vehn, K. J. Witte. Phys. Rev. Lett., 93, 045003(2004).
[18] A. G. MacPhee, L. Divol, A. J. Kemp, K. U. Akli, F. N. Beg, C. D. Chen, H. Chen, D. S. Hey, R. J. Fedosejevs, R. R. Freeman, M. Henesian, M. H. Key, S. Le Pape, A. Link, T. Ma, A. J. Mackinnon, V. M. Ovchinnikov, P. K. Patel, T. W. Phillips, R. B. Stephens, M. Tabak, R. Town, Y. Y. Tsui, L. D. Van Woerkom, M. S. Wei, S. C. Wilks. Phys. Rev. Lett., 104, 055002(2010).
[19] F. Wagner, S. Bedacht, A. Ortner, M. Roth, A. Tauschwitz, B. Zielbauer, V. Bagnoud. Opt. Express, 22, 29505(2014).
[20] K. H. Hong, B. Hou, J. A. Nees, E. Power, G. A. Mourou. Appl. Phys. B, 81, 447(2005).
[21] F. Tavella, K. Schmid, N. Ishii, A. Marcinkevičius, L. Veisz, F. Krausz. Appl. Phys. B, 81, 753(2005).
[22] L. P. Yu, Y. Xu, Y. Q. Liu, Y. Y. Li, S. Li, Z. Z. Liu, W. K. Li, F. X. Wu, X. J. Yang, Y. L. Yang, C. Wang, X. M. Lu, Y. X. Leng, R. X. Li, Z. Z. Xu. Opt. Express, 26, 2625(2018).
[23] J. G. Ma, P. Yuan, J. Wang, G. Q. Xie, H. Y. Zhu, L. Q. Qian. High Power Laser Sci. Eng, 6, e61(2018).
[24] I. Jovanovic, C. Brown, C. Haefner, M. Shverdin, M. Taranowski, C. P. J. BartyConference on Lasers and Electro-Optics/Quantum Electronics and Laser Science Conference and Photonic Applications Systems Technologies. , , , , , and , in (), paper JThD137.(2007).
[25] T. Oksenhendler, P. Bizouard, O. Albert, S. Bock, U. Schramm. Opt. Express, 25, 12588(2017).
[26] A. C. Aiken, P. Oliveira, I. E. Bradley, E. Dilworth, M. Galletti, B. Parry, M. Galimberti, I. O. Musgrave. Opt. Commun., 483, 126672(2021).
[27] P. Wang, X. Shen, J. Liu, R. X. Li. Adv. Photon., 1, 056001(2019).
[28] J. G. Ma, Y. Z. Wang, P. Yuan, G. Q. Xie, H. Y. Zhu, L. Q. Qian. Opt. Lett., 37, 4486(2012).
[29] J. F. He, C. J. Zhu, Y. S. Wang, G. H. Cheng, K. S. Zou, D. K. Wu, X. D. Xie. Opt. Express, 19, 4438(2011).
[30] R. C. Shah, R. P. Johnson, T. Shimada, B. M. Hegelich. Eur. Phy. J. D, 55, 305(2009).
[31] C. Dorrer, J. Bromage, J. D. Zuegel. Opt. Express, 16, 13534(2008).
[32] J. G. Ma, P. Yuan, X. P. Ouyang, J. Wang, G. Q. Xie, L. J. Qian. Adv. Photonics Res., 2, 2100105(2021).
[33] J. Q. Zhu, X. L. Xie, M. Z. Sun, J. Kang, Q. W. Yang, A. L. Guo, H. D. Zhu, P. Zhu, Q. Gao, X. Liang, Z. R. Cui, S. H. Yang, C. Zhang, Z. Q. Lin. High Power Laser Sci. Eng., 6, e29(2018).
[34] J. Q. Zhu, J. Zhu, X. C. Li, B. Q. Zhu, W. X. Ma, X. Q. Lu, W. Fan, Z. G. Liu, S. L. Zhou, G. Xu, G. W. Zhang, X. L. Xie, L. Yang, J. F. Wang, X. P. Ouyang, L. Wang, D. W. Li, P. Q. Yang, Q. T. Fan, M. Y. Sun, C. Liu, D. A. Liu, Y. L. Zhang, H. Tao, M. Z. Sun, P. Zhu, B. Y. Wang, Z. Y. Jiao, L. Ren, D. Z. Liu, X. Jiao, H. B. Huang, Z. Q. Lin. High Power Laser Sci. Eng, 6, e55.
[35] Y. Z. Wang, P. Yuan, J. G. Ma, L. J. Qian. Appl. Phys. B, 111, 501(2013).
[36] N. Stuart, T. Robinson, D. Hillier, N. Hopps, B. Parry, I. Musgrave, G. Nersisyan, A. Sharba, M. Zepf, R. A. Smith. Opt. Lett., 41, 3221(2016).


Set citation alerts for the article
Please enter your email address

© Copyright 2018-2021 | Chinese Laser Press. All Rights Reserved 沪ICP备15018463号-20