


Xiang Wang, Jianjun He, Jialiang Wei, Huie Zhu. Stochastics in EUV Lithography and Recent Research Status[J]. Chinese Journal of Lasers, 2024, 51(7): 0701006
- Chinese Journal of Lasers
- Vol. 51, Issue 7, 0701006 (2024)
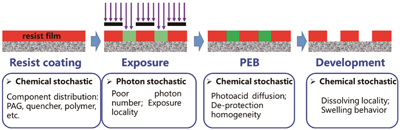
Fig. 1. Photoresist exposure process and origin of EUV stochastics in different lithography processes
![Differences between traditional and stochastic failures[5]. (a) Stochastic failures; (b) traditional types of defects](/richHtml/zgjg/2024/51/7/0701006/img_02.jpg)
Fig. 2. Differences between traditional and stochastic failures[5]. (a) Stochastic failures; (b) traditional types of defects
Fig. 4. Absorption cross sections of elements (Z=1‒86) at EUV[24]
Fig. 5. Line-edge roughness (LER) values after the entire CAR patterning process in low Tg and high Tg[85]. (a) LER as a function of the protected site ratio fp when the number of beads N=64; (b) LER as a function of the number of beads N at fixed fp=0.5; (c) 3D image of residual polymer from (a) for low Tg resist; (d) 3D image of residual polymer from (b) for low Tg resist
Fig. 6. Sequence controlled resists based on polypeptoid [86]. (a) Scheme showing monomer structures and polymer sequence; (b) patterns produced from polypeptoid of different sequences under DUV exposure
Fig. 7. Concept and lithographic results of novel functionalized materials[74]
Fig. 8. Defect analysis for BQ variation[75]. (a) Total post litho defect density with e-beam; (b) nanobridge defect density; (c) line break defect density
Fig. 9. Process flow of PTD (positive-tone development) and NTI (negative-tone imaging) lithography[89-90]
Fig. 10. Process windows for line/space between EUV PTD and EUV NTD[92]
Fig. 11. Distribution of light intensity on high reflective substrate and a baking step smoothens this concentration pattern by diffusion (from the left to the right shows the chronological sequence of a numerical modelling)[94]
Fig. 12. Simulation results of LCDU (3σ) variation of 20 nm half pitch (HP) dense hole pattern with cluster diameter (same imaging conditions)[95]
Fig. 13. Schematic of the fully coupled Monte Carlo simulation for calculating reaction distributions in resist films[120]
Fig. 14. Stochastic effect analysis based on Monte Carlo method[15,120]. (a) Monte Carlo simulated photon adsorption (red ball), secondary electron generation (blue ball), and acid-induced deprotection reaction (green dot) in DUV and EUV CAR; (b) probability model of the stochastic effect for statistical analysis
Fig. 15. Framework of the multiscale computation simulation model[124]. (a) Density functional theory (DFT), molecular dynamics (MD), and finite difference method (FDM) combined computational study of the exposure process of EUV photoresist materials; (b) simulating the effect of PEB time on exposed morphology
|
Table 1. Structure, density and linear absorption coefficient of selected polymers[23]

Set citation alerts for the article
Please enter your email address
© Copyright 2018-2021 | Chinese Laser Press. All Rights Reserved 沪ICP备15018463号-20