• Photonics Research
  • Vol. 9, Issue 4, 590 (2021)
Daiqi Xiong, Jiaqi Luo, Muhammad Rosdi Abu Hassan, Xu Wu, and Wonkeun Chang*
Author Affiliations
  • School of Electrical and Electronic Engineering, Nanyang Technological University, Singapore 639798, Singapore
  • show less
    DOI: 10.1364/PRJ.415778 Cite this Article Set citation alerts
    Daiqi Xiong, Jiaqi Luo, Muhammad Rosdi Abu Hassan, Xu Wu, Wonkeun Chang. Low-energy-threshold deep-ultraviolet generation in a small-mode-area hollow-core fiber[J]. Photonics Research, 2021, 9(4): 590 Copy Citation Text show less
    (a) Scanning electron micrographs showing cross sections of the original tubular hollow-core fiber (left) and SMA-HCF produced via tapering (right). (b) Transmission spectrum of the original fiber and (c) that of SMA-HCF. Gray shaded regions are the high-loss bands that appear due to cladding element wall thickness. The loss measured at 800 nm using cut-back method is 16 dB⋅m−1. The loss calculated via finite-element modeling assuming an ideal structure is presented in red dashed line in (c). The gray dotted line is the expected normalized transmission of the 5-cm-long SMA-HCF, which is obtained from the calculated loss and source spectrum.
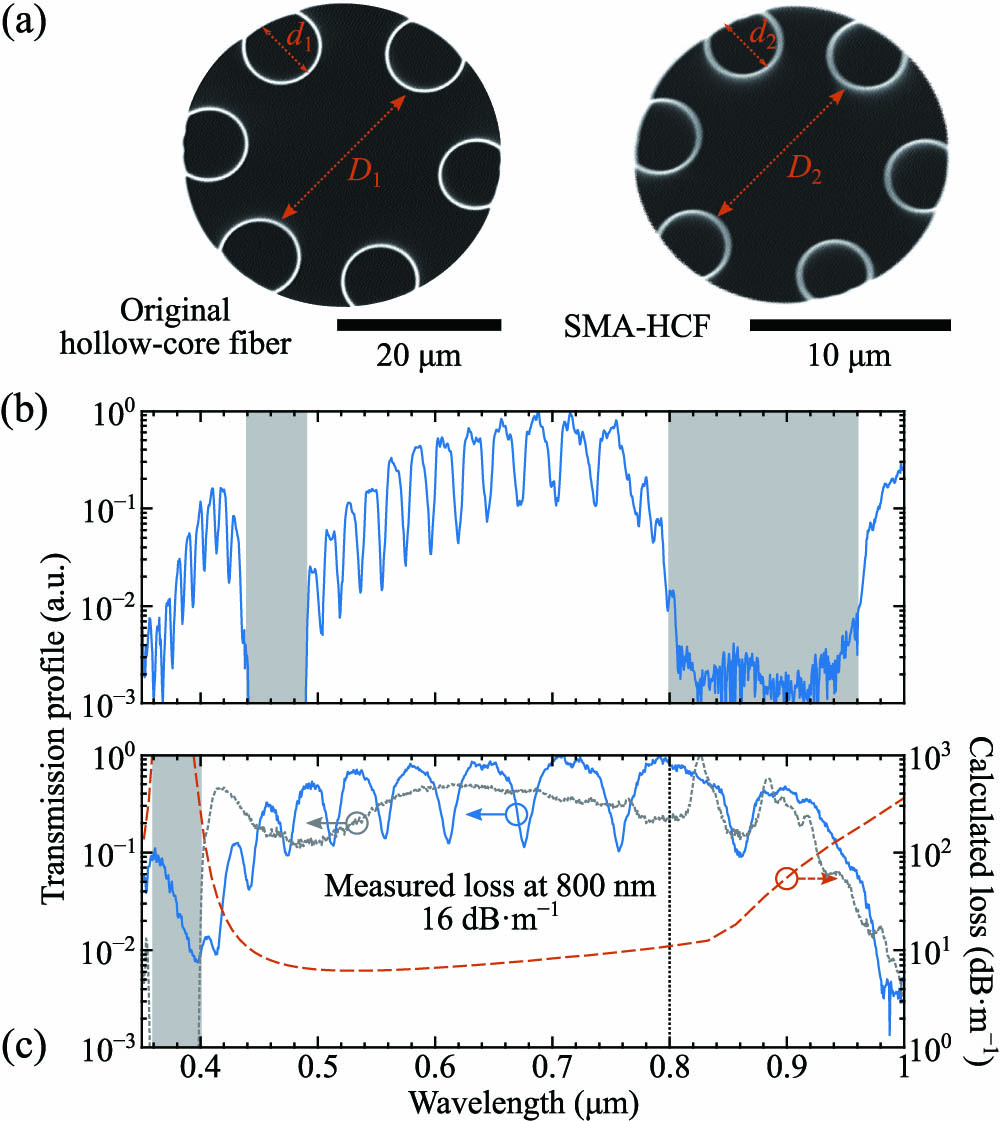
    Fig. 1. (a) Scanning electron micrographs showing cross sections of the original tubular hollow-core fiber (left) and SMA-HCF produced via tapering (right). (b) Transmission spectrum of the original fiber and (c) that of SMA-HCF. Gray shaded regions are the high-loss bands that appear due to cladding element wall thickness. The loss measured at 800 nm using cut-back method is 16  dBm1. The loss calculated via finite-element modeling assuming an ideal structure is presented in red dashed line in (c). The gray dotted line is the expected normalized transmission of the 5-cm-long SMA-HCF, which is obtained from the calculated loss and source spectrum.
    (a) Schematic of the experiment. HWP, half-wave plate; TFP, thin-film polarizer; M, mirror; L, lens. (b) Intensity (blue solid line) and phase (red dashed line) profiles of the pulse at Point A obtained using second-harmonic generation frequency-resolved optical gating technique. (c) Measured (blue solid line) and reconstructed (red dashed line) spectral profiles. (d) Acquired (left) and retrieved (right) spectrograms.
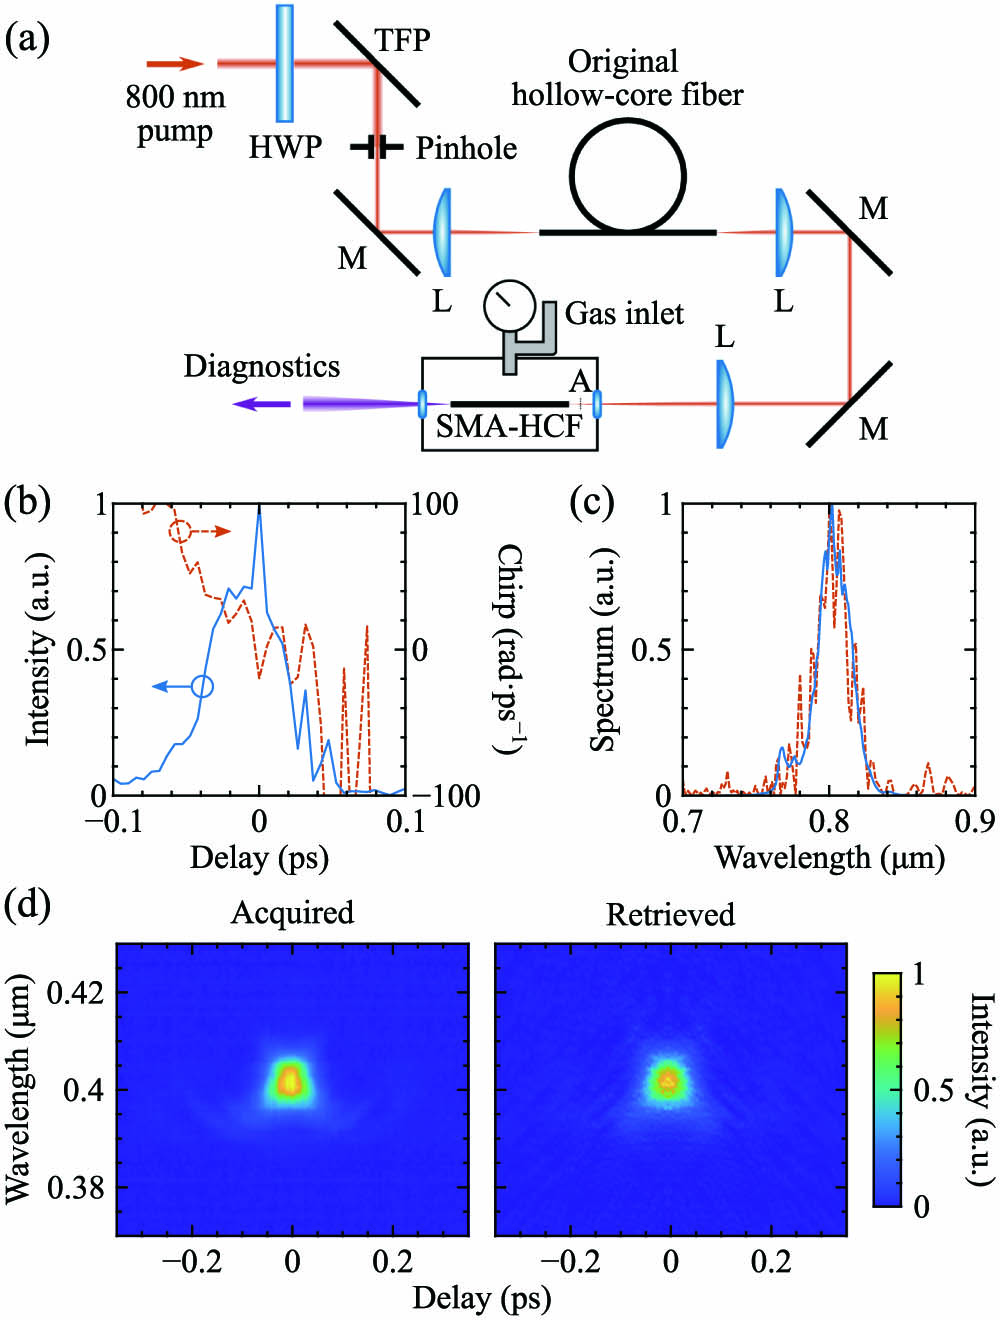
    Fig. 2. (a) Schematic of the experiment. HWP, half-wave plate; TFP, thin-film polarizer; M, mirror; L, lens. (b) Intensity (blue solid line) and phase (red dashed line) profiles of the pulse at Point A obtained using second-harmonic generation frequency-resolved optical gating technique. (c) Measured (blue solid line) and reconstructed (red dashed line) spectral profiles. (d) Acquired (left) and retrieved (right) spectrograms.
    Spectra of the beam exiting from the 5-cm-long SMA-HCF pressurized with 40 bar argon when the observed output pulse energies are (a) 125 nJ and (b) 100 nJ. The corresponding pump energies are 150 and 125 nJ, respectively. The inset in (a) shows energy contained in the entire spectrum and that in the UV part (<400 nm) when the end face of the light collecting patch cable is moved across the output beam horizontally and vertically crossing the center. They exhibit excellent Gaussian fits (dashed and solid lines), indicating that the pump and UV radiations both emerge from the fundamental core mode in SMA-HCF.
    Fig. 3. Spectra of the beam exiting from the 5-cm-long SMA-HCF pressurized with 40 bar argon when the observed output pulse energies are (a) 125 nJ and (b) 100 nJ. The corresponding pump energies are 150 and 125 nJ, respectively. The inset in (a) shows energy contained in the entire spectrum and that in the UV part (<400  nm) when the end face of the light collecting patch cable is moved across the output beam horizontally and vertically crossing the center. They exhibit excellent Gaussian fits (dashed and solid lines), indicating that the pump and UV radiations both emerge from the fundamental core mode in SMA-HCF.
    (a) Simulated spectral profile at the output of the 5-cm-long SMA-HCF for 150 μJ, 52 fs pump centered at 800 nm. The fiber is filled with argon at 40 bar. Measured spectrum for the identical condition is shown in the gray shaded region. (b) Its spectral evolution along SMA-HCF. The zero-dispersion wavelength is marked with a white vertical dotted line with N and A denoting normal and anomalous dispersion regimes, respectively. (c) Dispersive wave phase-matching diagram for 800 nm pump. The phase-matching point is indicated by a red vertical dashed line. (d) The degree of first-order coherence of the output calculated based on 50 simulations with random shot-noise added in the pump; 1 denotes complete preservation of shot-to-shot coherence and 0 otherwise. Red shades are the high-loss regions of SMA-HCF.
    Fig. 4. (a) Simulated spectral profile at the output of the 5-cm-long SMA-HCF for 150 μJ, 52 fs pump centered at 800 nm. The fiber is filled with argon at 40 bar. Measured spectrum for the identical condition is shown in the gray shaded region. (b) Its spectral evolution along SMA-HCF. The zero-dispersion wavelength is marked with a white vertical dotted line with N and A denoting normal and anomalous dispersion regimes, respectively. (c) Dispersive wave phase-matching diagram for 800 nm pump. The phase-matching point is indicated by a red vertical dashed line. (d) The degree of first-order coherence of the output calculated based on 50 simulations with random shot-noise added in the pump; 1 denotes complete preservation of shot-to-shot coherence and 0 otherwise. Red shades are the high-loss regions of SMA-HCF.
    Spectra of the beam leaving the 5-cm-long SMA-HCF for different argon pressures when the observed output pulse energy is 100 nJ. This amounts to approximately 125 nJ pump. The entire spectra are presented in the left-hand-side panel, and corresponding magnified UV parts are shown in the right-hand side.
    Fig. 5. Spectra of the beam leaving the 5-cm-long SMA-HCF for different argon pressures when the observed output pulse energy is 100 nJ. This amounts to approximately 125 nJ pump. The entire spectra are presented in the left-hand-side panel, and corresponding magnified UV parts are shown in the right-hand side.
    Daiqi Xiong, Jiaqi Luo, Muhammad Rosdi Abu Hassan, Xu Wu, Wonkeun Chang. Low-energy-threshold deep-ultraviolet generation in a small-mode-area hollow-core fiber[J]. Photonics Research, 2021, 9(4): 590
    Download Citation