
Daiqi Xiong, Jiaqi Luo, Muhammad Rosdi Abu Hassan, Xu Wu, Wonkeun Chang. Low-energy-threshold deep-ultraviolet generation in a small-mode-area hollow-core fiber[J]. Photonics Research, 2021, 9(4): 590
- Photonics Research
- Vol. 9, Issue 4, 590 (2021)
Abstract
1. INTRODUCTION
Gas-filled hollow-core fibers present an interesting means for realizing femtosecond ultraviolet (UV) light sources [1–3]. The technique capitalizes on the unique dispersion landscape of hollow-core fibers, which permits phase-matched conversion of the pump in the near-infrared to UV through dispersive wave generation. This coupled with solarization-free guidance of UV in hollow-core fibers has led to multiple demonstrations of the UV generation process, achieving wavelengths as short as 110 nm [4].
For the onset of UV in the gas-filled hollow-core fiber, the pump must accumulate sufficient nonlinear phase shifts along the propagation. One common drawback of the gas-based system in this respect is its relatively small nonlinear index. For instance, the third-order susceptibility of argon at its standard pressure and temperature is about 4 orders of magnitude lower than that of fused silica. While this shortfall can be compensated to some degree by increasing the gas pressure or choosing heavier gas, doing so also largely affects the dispersion, shifting the phase-matching point toward a longer wavelength, which may not be desirable in many applications. Alternatively, one can use longer propagation distance or higher pump peak power to produce enough nonlinear phase shifts. However, the former is subject to transmission and bending losses in the hollow-core fiber, and the latter raises the bar on the pump source requirement.
One simple approach to mitigate the issue is to come up with a hollow-core fiber that tightly confines light into very small mode area. In the small-mode-area hollow-core fiber (SMA-HCF), much higher intensity is achieved for given peak power, allowing large nonlinear effects to be induced from relatively small pulse energy. It exploits the universal energy scaling in gas-based nonlinear optics [5]. Up-scaling of the process demonstrated recently in a large-core capillary led to generating microjoule-level UV pulses [4]. The down-scaling has also been tested in a kagomé-type hollow-core photonic-crystal fiber with flat-to-flat core diameter of 22 μm, achieving the UV radiation by launching a 800 nJ pump, which is the lowest reported until now [6]. We note, by confining the beam further into , the pulse energy requirement for the UV emission can be reduced to sub-hundred nanojoules—to a level that is accessible by modern compact femtosecond oscillators operating at multi-megahertz repetition rates [7]. This opens a potential pathway to develop a compact and robust UV frequency comb source.
Sign up for Photonics Research TOC. Get the latest issue of Photonics Research delivered right to you!Sign up now
In this work, we report low-energy-threshold onset of the wavelength-tunable deep-UV pulses in an argon-filled hollow-core fiber. This is achieved in a short piece of SMA-HCF, which is obtained by scaling down a tubular hollow-core fiber through tapering. We demonstrate that with the effective fundamental mode area of , the energy threshold for triggering the UV radiation can be as low as 125 nJ.
2. SMALL-MODE-AREA HOLLOW-CORE FIBER
The transmission loss is the main point of concern when a small-scale hollow-core fiber is considered. In both a simple dielectric capillary and an antiresonant-guiding hollow-core fiber, the loss increases rapidly with reduction in the core size [8,9]. We note, on the other hand, a remarkable recent progress in low-loss antiresonant-guiding hollow-core fibers [10,11]. Studies have shown substantial suppression of the loss when negative curvatures are introduced at the core-cladding interface. This has promoted a simple fiber design that consists only of several non-touching cylindrical cladding tubes surrounding the central hollow core [12,13]. The geometry of SMA-HCF is based on this nodeless tubular hollow-core fiber structure.
Fabricating a small-scale low-loss hollow-core fiber directly from the drawing tower is challenging. This is because, without a careful control, the cladding elements tend to stick to each other due to surface tension, forming dielectric nodes that substantially degrade light guidance [14]. Among the tubular-type hollow-core fibers, the smallest core diameter achieved straight from the thermal drawing so far is 15 μm intended to guide light at 355 nm [15]. One attractive approach to overcome this difficulty is to post-process the fiber in a tapering rig to gently stretch it under heat in a well-controlled manner [16]. This technique has been demonstrated for down-scaling a tubular hollow-core fiber to finally arrive at a core diameter as small as 5.8 μm [17].
For the fabrication of SMA-HCF, a tubular hollow-core fiber with the original core diameter of 25.6 μm is used. The tapering produces a down- and an up-transition regions, and between the two, there is a taper waist where the reduced dimension is maintained along its length. This part can serve as SMA-HCF. In our setup, we can produce the taper waist of up to 15 cm in length, which is sufficiently long for the experiment to follow.
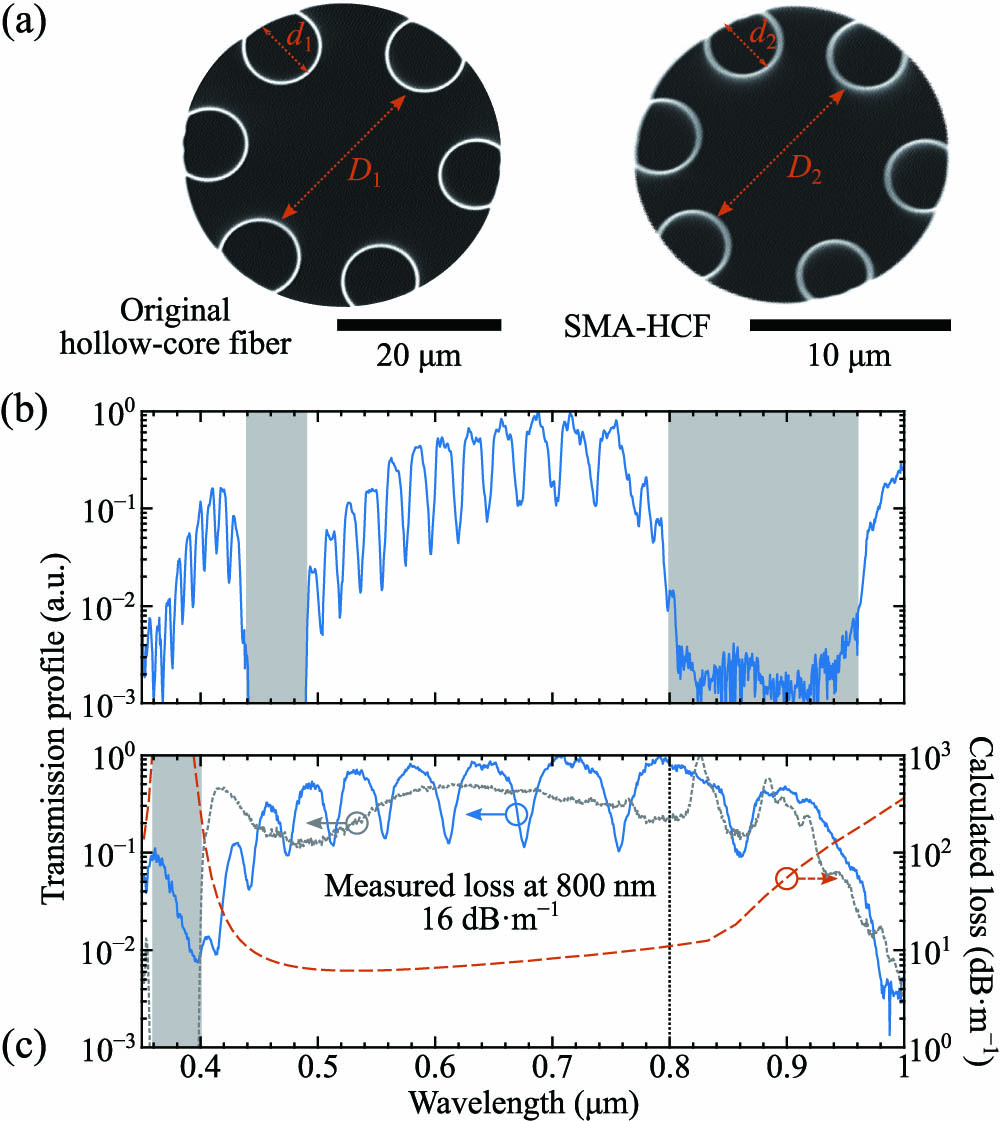
Figure 1.(a) Scanning electron micrographs showing cross sections of the original tubular hollow-core fiber (left) and SMA-HCF produced via tapering (right). (b) Transmission spectrum of the original fiber and (c) that of SMA-HCF. Gray shaded regions are the high-loss bands that appear due to cladding element wall thickness. The loss measured at 800 nm using cut-back method is
The transmission spectra of the original fiber and SMA-HCF obtained using a high-power xenon lamp are plotted in Figs. 1(b) and 1(c), respectively. The gray shaded regions are the high-loss bands that appear due to the cladding element wall thickness [18]. A reduction in the wall thickness from 415 nm in the original fiber to 186 nm in SMA-HCF blueshifts these loss bands correspondingly. That is, the first high-loss band is moved from 800–960 to 380–420 nm, and the second one is pushed from 440–490 to, supposedly, 200–220 nm, which is outside the coverage of our xenon lamp. In Fig. 1(c), light guidance in the core is not supported beyond 970 nm in SMA-HCF. This cutoff shifts to shorter wavelength with further reduction in the cross-sectional structure, placing an ultimate limit on the applicable scaling-down factor for a given pump wavelength. The loss at 800 nm measured using cut-back method is . The oscillations seen in the transmission spectra in Figs. 1(b) and 1(c) are attributed to the outer jacket thickness-induced resonances. They appear because of the incoherent xenon lamp exciting modes of the overall structure. Here, the outer jacket acts as an additional antiresonant reflection layer, resulting in the high-loss regions that are uniformly separated at a frequency governed by its thickness. This effect is comprehensively studied in thin-wall dielectric capillaries of different wall thicknesses [19]. The jacket thicknesses in the original fiber and SMA-HCF are 7 and 2.9 μm, amounting to the separations of 14.8 and 35.7 THz, respectively. These values are in good agreement with the fringe patterns in Figs. 1(b) and 1(c). Nonetheless, the jacket thickness-induced resonances have negligible impact on the fundamental core mode due to small spatial overlap between the core and dielectric jacket modes. With the use of a laser beam, the light can be coupled predominantly into the fundamental core mode and avoid the jacket thickness-induced resonances.
The loss spectrum of SMA-HCF calculated using finite-element modeling is presented in Fig. 1(c) as reference. Here, a uniform tubular hollow-core fiber that has a 10.6-μm-diameter core surrounded by six cladding tubes of diameter 4.45 μm and wall thickness 186 nm is assumed. Figure 1(c) shows also the expected normalized transmission of the 5-cm-long SMA-HCF, which is obtained from the calculated loss and source spectrum. The cutoff wavelength and locations of the high-loss bands in the calculation are in excellent agreement with the measured values. From the modeling, the loss is at 800 nm, which is close to the measured value.
Within the simple six-tube geometry, the lowest loss is achieved when the ratio of cladding tube diameter to core diameter is 0.6–0.8 [20]. Considering that this ratio is 0.42 in SMA-HCF, there still is room for further reduction in loss that can be realized by controlling the cladding tube size during the fabrication. For better improvement, we can adopt a fiber design that is optimized for ultra-low-loss transmission, such as the nested antiresonant nodeless hollow-core fiber [21]. Alternatively, the system can be pumped at a shorter wavelength, e.g., at the second harmonic, to increase the core diameter to wavelength ratio, which is the dominant factor influencing loss in hollow-core fibers [22].
The effective mode area of SMA-HCF is calculated to be at 800 nm. The small mode area presents an ideal observe broadening of the platform for hosting nonlinear experiments at low pulse energies.
3. EXPERIMENTAL SETUP
![]()
Figure 2.(a) Schematic of the experiment. HWP, half-wave plate; TFP, thin-film polarizer; M, mirror; L, lens. (b) Intensity (blue solid line) and phase (red dashed line) profiles of the pulse at Point A obtained using second-harmonic generation frequency-resolved optical gating technique. (c) Measured (blue solid line) and reconstructed (red dashed line) spectral profiles. (d) Acquired (left) and retrieved (right) spectrograms.
For the measurement of output spectrum, the exiting beam emerging from the output window of the gas chamber is collected directly using a fiber patch cable attached to the spectrometer. This raw measurement is intensity calibrated by applying spectral response functions of the diagnostic instruments. Further to that, rather low average power at the output of SMA-HCF makes it impractical to use an integrating sphere to collect the entire beam into the spectrometer. Hence, when taking measurements, the end face of the patch cable is placed at the center of the output beam. Since the divergence angle of the beam depends on the wavelength, the recorded spectrum needs to be scaled by the square of the wavelength to obtain true spectral composition of the total output. We affirm that the measured spectra presented in the subsequent sections have this correction factor applied.
4. RESULTS AND DISCUSSIONS
![]()
Figure 3.Spectra of the beam exiting from the 5-cm-long SMA-HCF pressurized with 40 bar argon when the observed output pulse energies are (a) 125 nJ and (b) 100 nJ. The corresponding pump energies are 150 and 125 nJ, respectively. The inset in (a) shows energy contained in the entire spectrum and that in the UV part (
The UV radiation weakens as the pump energy is decreased, and it disappears into the noise when the observed output pulse energy is below 100 nJ. This amounts to the pump energy of 125 nJ. At this point, there is only a small peak that is approximately 30 dB down from the pump at 239 nm as shown in Fig. 3(b). We highlight that the demonstrated pump energy threshold is the lowest reported so far, and it is at the level that can be delivered by modern high-repetition-rate femtosecond laser oscillators. One major limiting factor in this regard is the poor coupling efficiency, which we believe can be improved with further engineering of the gas chamber and fiber coupling optics.
We examine our observations numerically by solving the unidirectional field propagation equation. It is given by [24]
![]()
Figure 4.(a) Simulated spectral profile at the output of the 5-cm-long SMA-HCF for 150 μJ, 52 fs pump centered at 800 nm. The fiber is filled with argon at 40 bar. Measured spectrum for the identical condition is shown in the gray shaded region. (b) Its spectral evolution along SMA-HCF. The zero-dispersion wavelength is marked with a white vertical dotted line with N and A denoting normal and anomalous dispersion regimes, respectively. (c) Dispersive wave phase-matching diagram for 800 nm pump. The phase-matching point is indicated by a red vertical dashed line. (d) The degree of first-order coherence of the output calculated based on 50 simulations with random shot-noise added in the pump; 1 denotes complete preservation of shot-to-shot coherence and 0 otherwise. Red shades are the high-loss regions of SMA-HCF.
The UV is generated in the form of a dispersive wave [28]. The spectral evolution along SMA-HCF leading to this output is presented in Fig. 4(b). After the launch, the 150 nJ pump, which amounts to a higher-order soliton of order 4.7, undergoes temporal compression and spectral broadening due to interplay between the anomalous dispersion and nonlinearity. Eventually, the low-intensity spectral tail of the pump reaches the phase-matching point indicated with a red vertical dashed line in Fig. 4, and conversion from the pump to this wavelength takes place. The phase-matching condition is obtained using
The shot-to-shot coherence of the output is quantified numerically and presented in Fig. 4(d). It is obtained by running 50 simulations with random shot-noise added in the input pulse and calculating the degree of first-order coherence between them, such that 1 denotes complete preservation of the shot-to-shot coherence and 0 otherwise [30]. The entire output maintains a high degree of coherence, meaning that the phase relation between the spectral components in the pump and UV band is well-maintained.
![]()
Figure 5.Spectra of the beam leaving the 5-cm-long SMA-HCF for different argon pressures when the observed output pulse energy is 100 nJ. This amounts to approximately 125 nJ pump. The entire spectra are presented in the left-hand-side panel, and corresponding magnified UV parts are shown in the right-hand side.
Again, we notice a similar spectral feature at 400 nm as observed in Fig. 3, which is caused by the band edge effect. Its location is neither affected by the pulse energy nor gas pressure as is apparent in Figs. 3 and 5.
5. CONCLUSION
We demonstrate low-energy-threshold onset of the wavelength-tunable deep-UV emission in SMA-HCF through dispersive wave generation. The fiber is obtained by post-processing a nodeless tubular hollow-core fiber on a tapering rig. It confines light tightly into a small mode area allowing accumulation of nonlinear phase shift that is sufficient for the frequency conversion process with relatively small pump pulse energy. The energy scaling down is achieved alongside the reduction in the length requirement. This not only mitigates the issue of having high attenuation per unit length in SMA-HCF, but it is also advantageous for building a compact system. It opens a promising avenue for a compact wavelength-tunable UV frequency comb source driven directly by a femtosecond oscillator operating at a multi-megahertz repetition rate.
Acknowledgment
Acknowledgment. The authors thank J. C. Travers for valuable discussion.
References
[1] N. Y. Joly, J. Nold, W. Chang, P. Hölzer, A. Nazarkin, G. Wong, F. Biancalana, P. St. J. Russell. Bright spatially coherent wavelength-tunable deep-UV laser source using an Ar-filled photonic crystal fiber. Phys. Rev. Lett., 106, 203901(2011).
[2] K. F. Mak, J. C. Travers, P. Hölzer, N. Y. Joly, P. St. J. Russell. Tunable vacuum-UV to visible ultrafast pulse source based on gas-filled Kagome-PCF. Opt. Express, 21, 10942-10953(2013).
[3] F. Köttig, F. Tani, C. M. Biersach, J. C. Travers, P. St. J. Russell. Generation of microjoule pulses in the deep ultraviolet at megahertz repetition rates. Optica, 4, 1272-1276(2017).
[4] J. C. Travers, T. F. Grigorova, C. Brahms, F. Belli. High-energy pulse self-compression and ultraviolet generation through soliton dynamics in hollow capillary fibres. Nat. Photonics, 13, 547-554(2019).
[5] C. M. Heyl, H. Coudert-Alteirac, M. Miranda, M. Louisy, K. Kovács, V. Tosa, E. Balogh, K. Varjú, A. L’Huillier, A. Couairon, C. L. Arnold. Scale-invariant nonlinear optics in gases. Optica, 3, 75-81(2016).
[6] P. Hosseini, A. Ermolov, F. Tani, D. Novoa, P. St. J. Russell. UV soliton dynamics and Raman-enhanced supercontinuum generation in photonic crystal fiber. ACS Photon., 5, 2426-2430(2018).
[7] T. Südmeyer, S. Marchese, S. Hashimoto, C. Baer, G. Gingras, B. Witzel, U. Keller. Femtosecond laser oscillators for high-field science. Nat. Photonics, 2, 599-604(2008).
[8] E. A. Marcatili, R. Schmeltzer. Hollow metallic and dielectric waveguides for long distance optical transmission and lasers. Bell Syst. Tech. J., 43, 1783-1809(1964).
[9] M. Zeisberger, M. A. Schmidt. Analytic model for the complex effective index of the leaky modes of tube-type anti-resonant hollow core fibers. Sci. Rep., 7, 11761(2017).
[10] S.-F. Gao, Y.-Y. Wang, W. Ding, D.-L. Jiang, S. Gu, X. Zhang, P. Wang. Hollow-core conjoined-tube negative-curvature fibre with ultralow loss. Nat. Commun., 9, 2828(2018).
[11] G. T. Jasion, T. D. Bradley, K. Harrington, H. Sakr, Y. Chen, E. N. Fokoua, I. A. Davidson, A. Taranta, J. R. Hayes, D. J. Richardson, F. Poletti. Hollow core NANF with 0.28 db/km attenuation in the C and L bands. Optical Fiber Communication Conference, Th4B.4(2020).
[12] A. N. Kolyadin, A. F. Kosolapov, A. D. Pryamikov, A. S. Biriukov, V. G. Plotnichenko, E. M. Dianov. Light transmission in negative curvature hollow core fiber in extremely high material loss region. Opt. Express, 21, 9514-9519(2013).
[13] B. Debord, A. Amsanpally, M. Chafer, A. Baz, M. Maurel, J. M. Blondy, E. Hugonnot, F. Scol, L. Vincetti, F. Gérôme, F. Benabid. Ultralow transmission loss in inhibited-coupling guiding hollow fibers. Optica, 4, 209-217(2017).
[14] G. T. Jasion, J. S. Shrimpton, Y. Chen, T. Bradley, D. J. Richardson, F. Poletti. MicroStructure Element Method (MSEM): viscous flow model for the virtual draw of microstructured optical fibers. Opt. Express, 23, 312-329(2015).
[15] S.-F. Gao, Y.-Y. Wang, W. Ding, P. Wang. Hollow-core negative-curvature fiber for UV guidance. Opt. Lett., 43, 1347-1350(2018).
[16] T. A. Birks, Y. W. Li. The shape of fiber tapers. J. Lightwave Technol., 10, 432-438(1992).
[17] R. Pennetta, M. T. Enders, M. H. Frosz, F. Tani, P. St. J. Russell. Fabrication and non-destructive characterization of tapered single-ring hollow-core photonic crystal fiber. APL Photonics, 4, 056105(2019).
[18] N. M. Litchinitser, A. K. Abeeluck, C. Headley, B. J. Eggleton. Antiresonant reflecting photonic crystal optical waveguides. Opt. Lett., 27, 1592-1594(2002).
[19] P. Rugeland, C. Sterner, W. Margulis. Visible light guidance in silica capillaries by antiresonant reflection. Opt. Express, 21, 29217-29222(2013).
[20] A. Deng, I. Hasan, Y. Wang, W. Chang. Analyzing mode index mismatch and field overlap for light guidance in negative-curvature fibers. Opt. Express, 28, 27974-27988(2020).
[21] F. Poletti. Nested antiresonant nodeless hollow core fiber. Opt. Express, 22, 23807-23828(2014).
[22] F. Yu, J. C. Knight. Negative curvature hollow-core optical fiber. IEEE J. Sel. Top. Quantum Electron., 22, 146-155(2016).
[23] K. W. DeLong, R. Trebino, J. Hunter, W. E. White. Frequency-resolved optical gating with the use of second-harmonic generation. J. Opt. Soc. Am. B, 11, 2206-2215(1994).
[24] W. Chang, A. Nazarkin, J. C. Travers, J. Nold, P. Hölzer, N. Y. Joly, P. S. Russell. Influence of ionization on ultrafast gas-based nonlinear fiber optics. Opt. Express, 19, 21018-21027(2011).
[25] A. Börzsönyi, Z. Heiner, M. P. Kalashnikov, A. P. Kovács, K. Osvay. Dispersion measurement of inert gases and gas mixtures at 800 nm. Appl. Opt., 47, 4856-4863(2008).
[26] H. J. Lehmeier, W. Leupacher, A. Penzkofer. Nonresonant third order hyperpolarizability of rare gases and N2 determined by third harmonic generation. Opt. Commun., 56, 67-72(1985).
[27] M. V. Ammosov, N. B. Delone, V. P. Krainov. Tunnel ionization of complex atoms and of atomic ions in an alternating electromagnetic field. Sov. Phys. JETP, 64, 1191-1194(1986).
[28] P. K. A. Wai, C. R. Menyuk, Y. C. Lee, H. H. Chen. Nonlinear pulse propagation in the neighborhood of the zero-dispersion wavelength of monomode optical fibers. Opt. Lett., 11, 464-466(1986).
[29] F. Tani, F. Köttig, D. Novoa, R. Keding, P. St.J. Russell. Effect of anti-crossings with cladding resonances on ultrafast nonlinear dynamics in gas-filled photonic crystal fibers. Photon. Res., 6, 84-88(2018).
[30] J. M. Dudley, S. Coen. Coherence properties of supercontinuum spectra generated in photonic crystal and tapered optical fibers. Opt. Lett., 27, 1180-1182(2002).

Set citation alerts for the article
Please enter your email address
© Copyright 2018-2021 | Chinese Laser Press. All Rights Reserved 沪ICP备15018463号-20