• Photonics Research
  • Vol. 9, Issue 9, 1796 (2021)
Zhe Zhuang, Daisuke Iida, Martin Velazquez-Rizo, and Kazuhiro Ohkawa*
Author Affiliations
  • Computer, Electrical and Mathematical Sciences and Engineering (CEMSE) Division, King Abdullah University of Science and Technology (KAUST), Thuwal 23955-6900, Saudi Arabia
  • show less
    DOI: 10.1364/PRJ.428168 Cite this Article Set citation alerts
    Zhe Zhuang, Daisuke Iida, Martin Velazquez-Rizo, Kazuhiro Ohkawa. 630-nm red InGaN micro-light-emitting diodes (<20 μm × 20 μm) exceeding 1 mW/mm2 for full-color micro-displays[J]. Photonics Research, 2021, 9(9): 1796 Copy Citation Text show less
    (a) Cross-sectional scanning transmission electron microscopy (STEM) image of our InGaN red LED structures. (b)–(d) Energy-dispersive X-ray spectroscopy (EDS) elemental mappings of In, Al, and Ga atoms distributed in the InGaN QWs and SLs using STEM EDS measurements. (e) Top-view and (f) high-resolution scanning electron microscopy (SEM) images for the red μLED array. (g) Cross-sectional TEM image of the single μLED device. (h)–(j) Cross-sectional high-resolution TEM (HRTEM) images for the interfaces between nitride materials and SiO2.
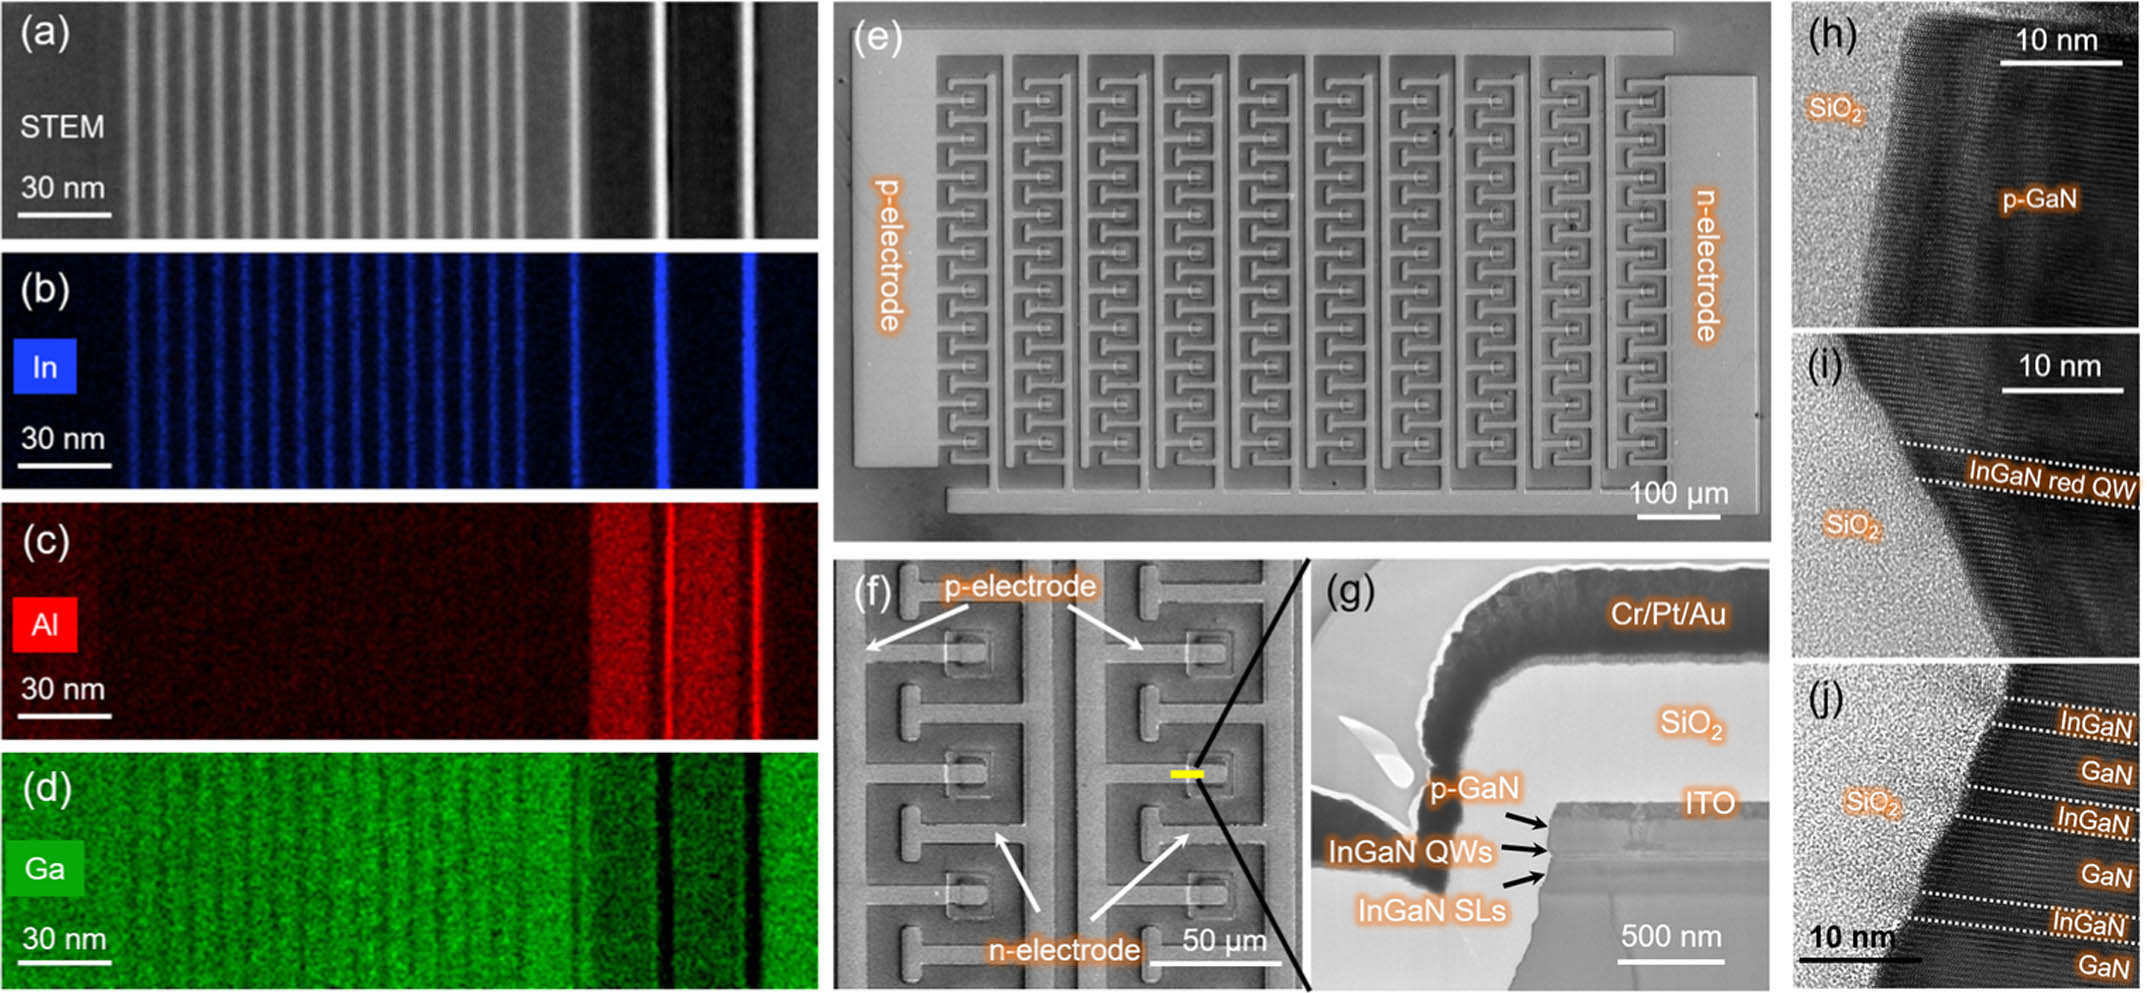
    Fig. 1. (a) Cross-sectional scanning transmission electron microscopy (STEM) image of our InGaN red LED structures. (b)–(d) Energy-dispersive X-ray spectroscopy (EDS) elemental mappings of In, Al, and Ga atoms distributed in the InGaN QWs and SLs using STEM EDS measurements. (e) Top-view and (f) high-resolution scanning electron microscopy (SEM) images for the red μLED array. (g) Cross-sectional TEM image of the single μLED device. (h)–(j) Cross-sectional high-resolution TEM (HRTEM) images for the interfaces between nitride materials and SiO2.
    (a) Absolute current and current densities of a typical 10×10 μLED array at different bias voltages. (b) EL spectrum of a typical 10×10 μLED array at 50 A/cm2. (c) Peak wavelength and FWHM of the 10×10 μLED array at different current densities. (d) Peak wavelength comparison with other works. (e) EQE and light output power of the 10×10 μLED array at different current densities. (f) Output power density comparison with other works. The solid dots are values from μLEDs based on on-wafer testing; the hollow dots are values from large sized LEDs measured in the integrating sphere. For comparison, we also estimated the value of this work in the integrating sphere.
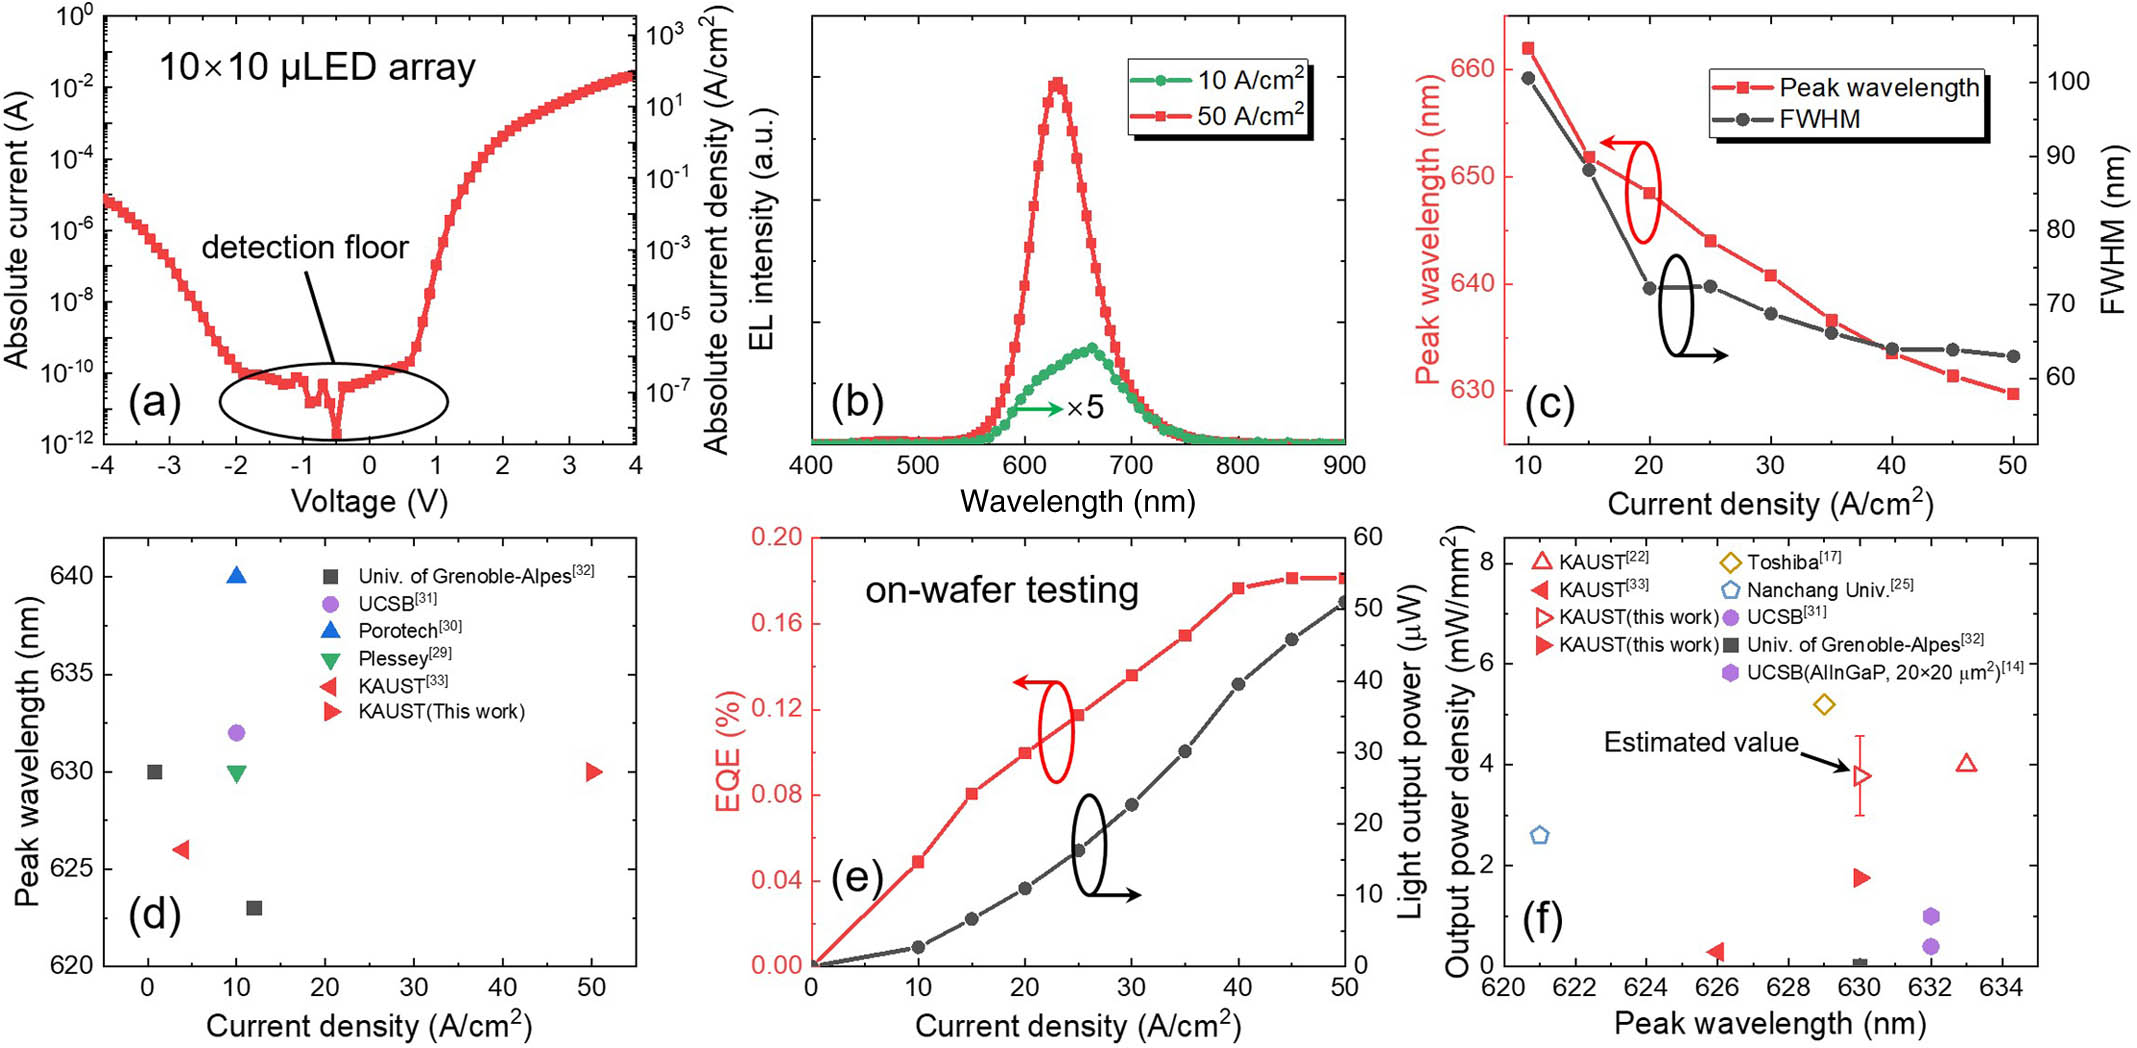
    Fig. 2. (a) Absolute current and current densities of a typical 10×10 μLED array at different bias voltages. (b) EL spectrum of a typical 10×10 μLED array at 50  A/cm2. (c) Peak wavelength and FWHM of the 10×10 μLED array at different current densities. (d) Peak wavelength comparison with other works. (e) EQE and light output power of the 10×10 μLED array at different current densities. (f) Output power density comparison with other works. The solid dots are values from μLEDs based on on-wafer testing; the hollow dots are values from large sized LEDs measured in the integrating sphere. For comparison, we also estimated the value of this work in the integrating sphere.
    (a)–(c) EL emission images of blue, green, and red 10×10 μLED arrays at the current density of 20 A/cm2. (d) CIE 1931 and (e) CIE 1976 diagram of blue, green, and red 10×10 μLED arrays at the current density of 20 and 50 A/cm2.
    Fig. 3. (a)–(c) EL emission images of blue, green, and red 10×10 μLED arrays at the current density of 20  A/cm2. (d) CIE 1931 and (e) CIE 1976 diagram of blue, green, and red 10×10 μLED arrays at the current density of 20 and 50  A/cm2.
    Zhe Zhuang, Daisuke Iida, Martin Velazquez-Rizo, Kazuhiro Ohkawa. 630-nm red InGaN micro-light-emitting diodes (<20 μm × 20 μm) exceeding 1 mW/mm2 for full-color micro-displays[J]. Photonics Research, 2021, 9(9): 1796
    Download Citation