• Chinese Optics Letters
  • Vol. 18, Issue 12, 121901 (2020)
Junbao Chen1、*, Ming Wang2, and Wei Xia2
Author Affiliations
  • 1Department of Information Technology, Nanjing Forest Police College, Nanjing 210023, China
  • 2School of Physics and Technology, Nanjing Normal University, Nanjing 210023, China
  • show less
    DOI: 10.3788/COL202018.121901 Cite this Article Set citation alerts
    Junbao Chen, Ming Wang, Wei Xia. Neural-network-assisted femtosecond laser pulse duration measurement using two-photon absorption[J]. Chinese Optics Letters, 2020, 18(12): 121901 Copy Citation Text show less
    Experimental setup of the TPA-based (a) intensity and (b) interferometric autocorrelator using a GaAs photodiode.
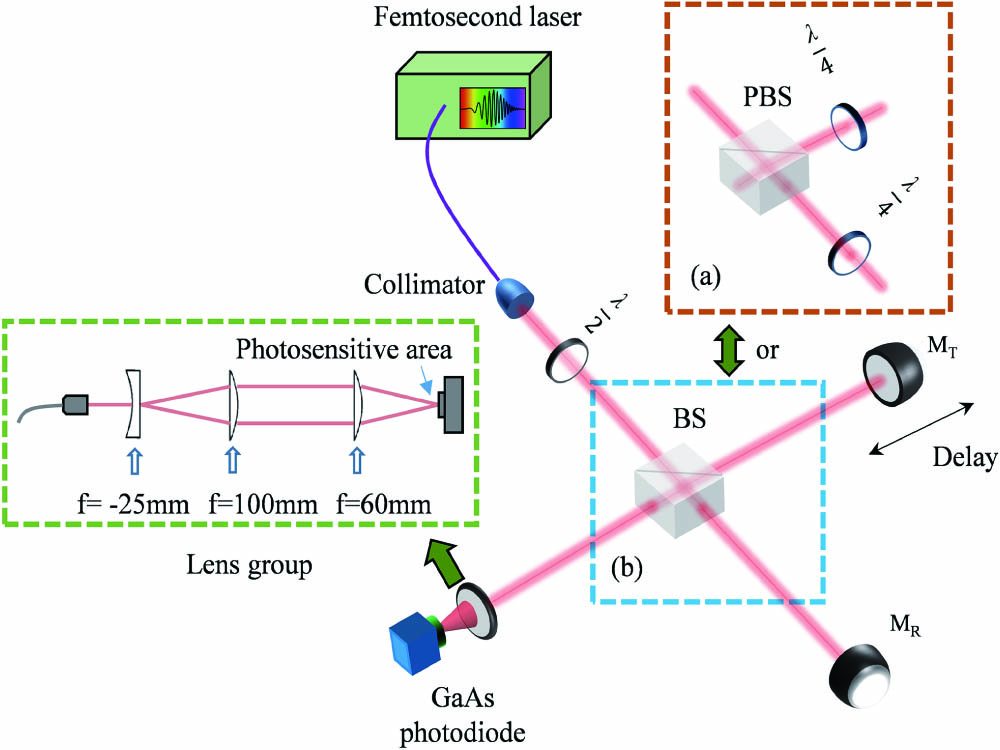
    Fig. 1. Experimental setup of the TPA-based (a) intensity and (b) interferometric autocorrelator using a GaAs photodiode.
    Example of a simple typical NN. (a) The basic process of machine learning and (b) the brief structure of the NN.
    Fig. 2. Example of a simple typical NN. (a) The basic process of machine learning and (b) the brief structure of the NN.
    Interferometric autocorrelation signals measured by the (a) TPA photodiode-based autocorrelator and (b) SHG autocorrelator.
    Fig. 3. Interferometric autocorrelation signals measured by the (a) TPA photodiode-based autocorrelator and (b) SHG autocorrelator.
    TPA-based autocorrelation traces curve-fitted by the NN with the performance of (a) 10−5, (b) 10−6, (c) 10−7, and (d) 10−8.
    Fig. 4. TPA-based autocorrelation traces curve-fitted by the NN with the performance of (a) 105, (b) 106, (c) 107, and (d) 108.
    Training process and error analysis. (a) The gradient at each epoch, (b) MSE at each epoch, (c) comparison between the output and target, and (d) structure of NN for this measurement system.
    Fig. 5. Training process and error analysis. (a) The gradient at each epoch, (b) MSE at each epoch, (c) comparison between the output and target, and (d) structure of NN for this measurement system.
    Gaussian-fitted autocorrelation traces by the L-M method. (a) Bad curve-fitting result for a signal with high noise and (b) good curve-fitting result for a signal with lower noise.
    Fig. 6. Gaussian-fitted autocorrelation traces by the L-M method. (a) Bad curve-fitting result for a signal with high noise and (b) good curve-fitting result for a signal with lower noise.
    Junbao Chen, Ming Wang, Wei Xia. Neural-network-assisted femtosecond laser pulse duration measurement using two-photon absorption[J]. Chinese Optics Letters, 2020, 18(12): 121901
    Download Citation