• Photonics Research
  • Vol. 11, Issue 8, 1397 (2023)
Zhibin Li1、2, Ziye Wu1, Zhuoqi Li1, Liangxun Ou1, Wenxiang Zhang1, Zhicong Lai1、2, Yu Zhang1、2, Mengyuan Xie1, Jieyuan Tang1, Wenguo Zhu1, Huadan Zheng1, Yongchun Zhong1, Xiong Deng3, Xihua Zou3, Zhe Chen1、2, and Jianhui Yu1、2、*
Author Affiliations
  • 1Key Laboratory of Optoelectronic Information and Sensing Technologies of Guangdong Higher Education Institutes, Department of Optoelectronic Engineering, Jinan University, Guangzhou 510632, China
  • 2Guangdong Provincial Key Laboratory of Optical Fiber Sensing and Communications, Department of Optoelectronic Engineering, Jinan University, Guangzhou 510632, China
  • 3Center for Information Photonics and Communications, School of Information Science and Technology, Southwest Jiaotong University, Chengdu 611756, China
  • show less
    DOI: 10.1364/PRJ.492840 Cite this Article Set citation alerts
    Zhibin Li, Ziye Wu, Zhuoqi Li, Liangxun Ou, Wenxiang Zhang, Zhicong Lai, Yu Zhang, Mengyuan Xie, Jieyuan Tang, Wenguo Zhu, Huadan Zheng, Yongchun Zhong, Xiong Deng, Xihua Zou, Zhe Chen, Jianhui Yu. High-sensitivity and fast-response fiber optic temperature sensor using an anti-resonant reflecting optical waveguide mechanism[J]. Photonics Research, 2023, 11(8): 1397 Copy Citation Text show less
    (a) Schematic diagram of the proposed temperature sensor. (b) Guiding mechanism of the proposed PDMS-filled SP-SHSF temperature sensor. (c) Simulated transmission spectra of the sensors with the temperature increase from 25°C to 30°C. (d) Field evolution along the vertical cross section (xz plane) of the PDMS-filled SP-SHSF structure at a temperature of 25°C for resonance and anti-resonance wavelengths.
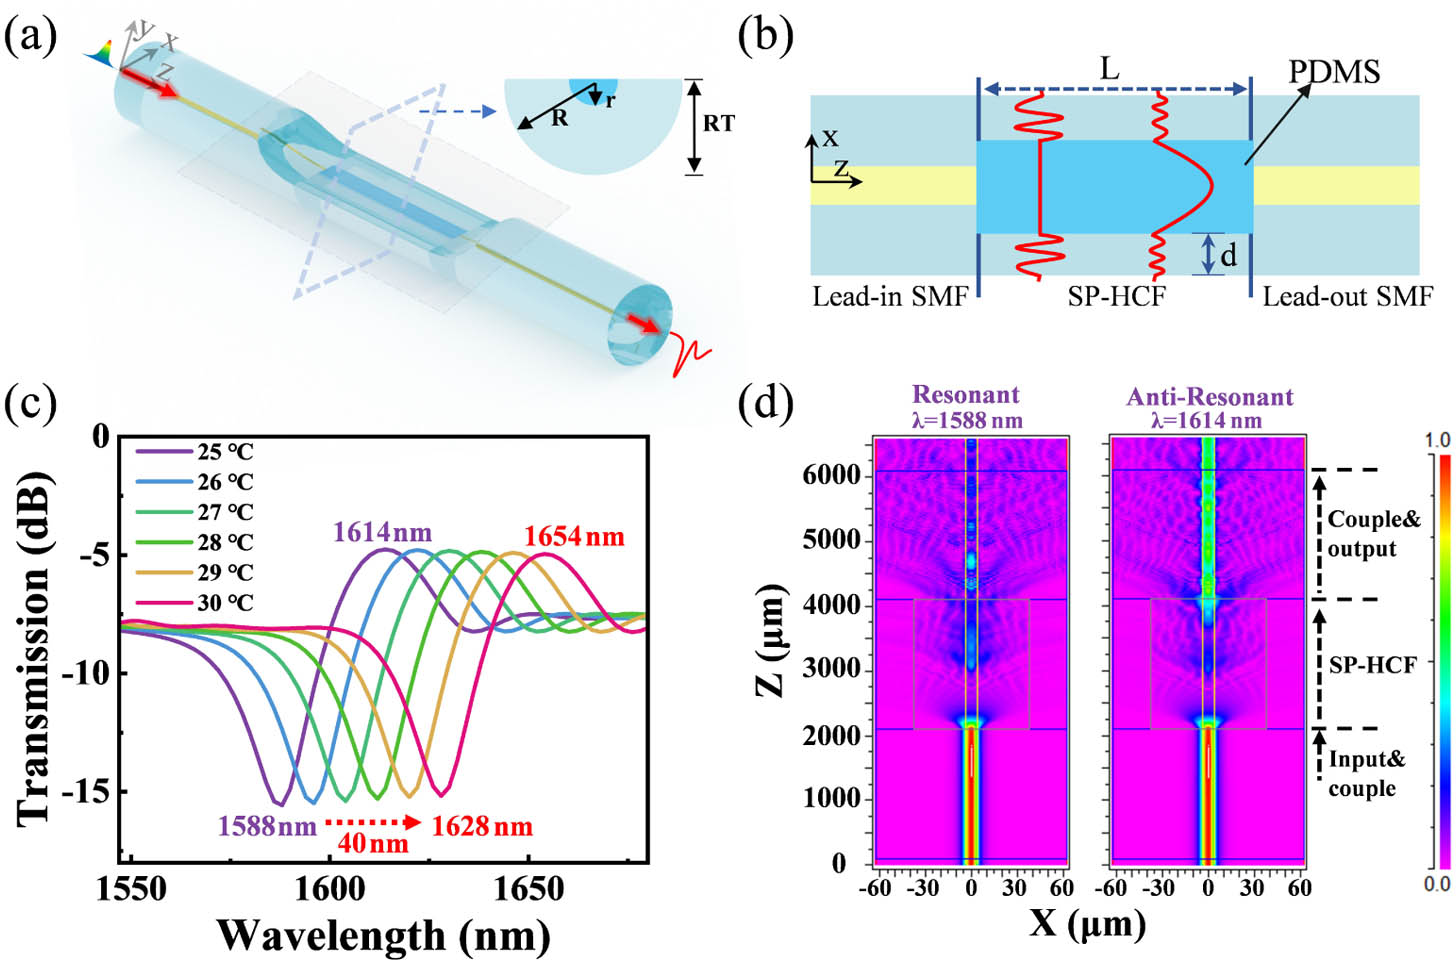
    Fig. 1. (a) Schematic diagram of the proposed temperature sensor. (b) Guiding mechanism of the proposed PDMS-filled SP-SHSF temperature sensor. (c) Simulated transmission spectra of the sensors with the temperature increase from 25°C to 30°C. (d) Field evolution along the vertical cross section (xz plane) of the PDMS-filled SP-SHSF structure at a temperature of 25°C for resonance and anti-resonance wavelengths.
    (a) Simulated transmission spectra for the proposed PDMS-filled SP-SHSF structure with HCF inner diameters of 30 μm and length of 2.0 mm (b) Dispersion curves of the proposed sensor structure. (c) Electric field vector distributions of the PDMS-filled SP-HCF.
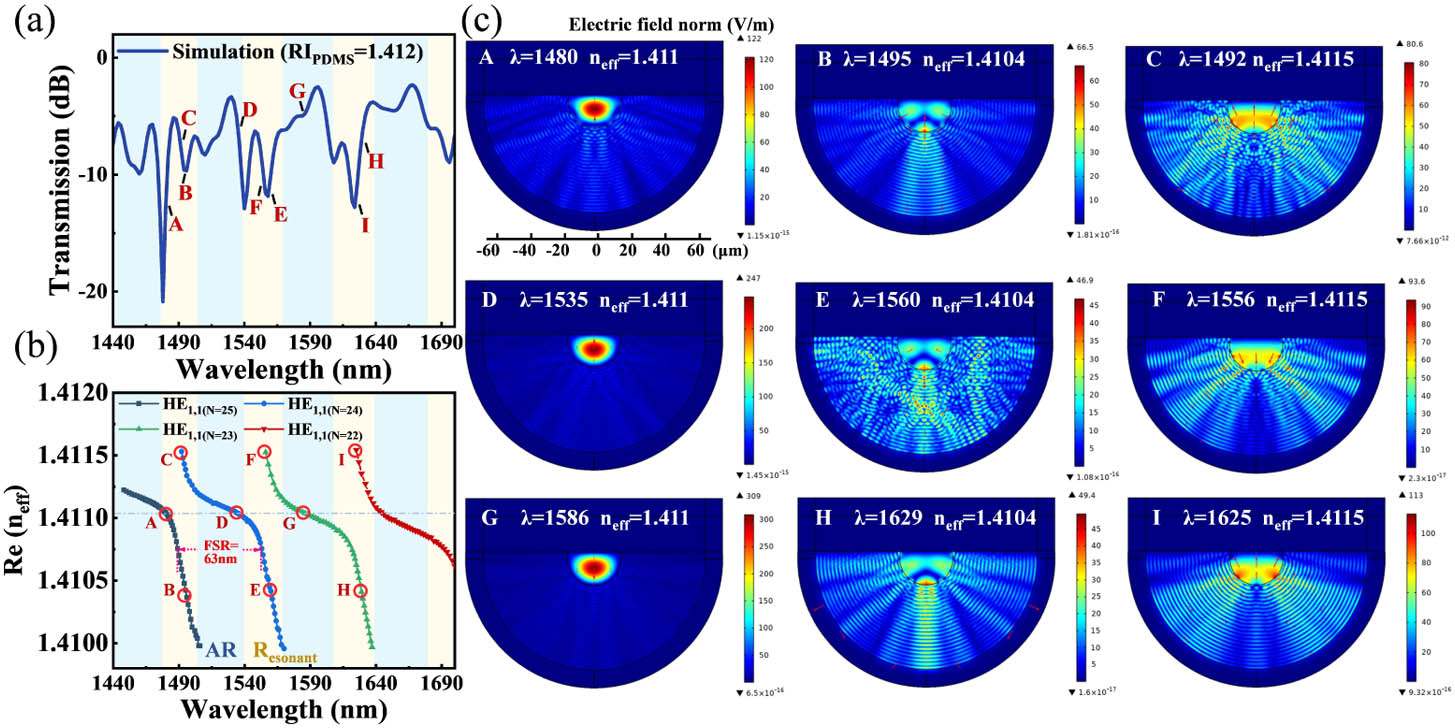
    Fig. 2. (a) Simulated transmission spectra for the proposed PDMS-filled SP-SHSF structure with HCF inner diameters of 30 μm and length of 2.0 mm (b) Dispersion curves of the proposed sensor structure. (c) Electric field vector distributions of the PDMS-filled SP-HCF.
    Simulated transmission spectra for the proposed PDMS-filled SP-SHSF structure with different HCF core diameters and lengths of HCF: (a) 20 μm, (b) 30 μm, (c) 75 μm. (d) Comparison of the simulated and formula calculated results for FSR with different HCF core diameters and HCF lengths in the same resonance wavelength range.
    Fig. 3. Simulated transmission spectra for the proposed PDMS-filled SP-SHSF structure with different HCF core diameters and lengths of HCF: (a) 20 μm, (b) 30 μm, (c) 75 μm. (d) Comparison of the simulated and formula calculated results for FSR with different HCF core diameters and HCF lengths in the same resonance wavelength range.
    Schematic of SP-SHSF fabrication process. (a), (b) Splicing two sections of SMFs with HCF and diagrams after splicing, respectively. (c) Grinding system. (d) Top view image of the SP-SHSF sample after side polishing. (e) Dropwise PDMS. (f) Side view of the proposed sensor.
    Fig. 4. Schematic of SP-SHSF fabrication process. (a), (b) Splicing two sections of SMFs with HCF and diagrams after splicing, respectively. (c) Grinding system. (d) Top view image of the SP-SHSF sample after side polishing. (e) Dropwise PDMS. (f) Side view of the proposed sensor.
    Experimental setup and measurement result for temperature sensing. (a) Schematic diagram of the experimental setup. (b) Transmittance spectral response to the temperature changing from 25°C to 85°C for the sensors, with SP-SHSF length of 2.0 mm. (c), (d) Zoomed-in view of resonant wavelength dip shifts for the temperature changing from 40°C to 45°C in (b) and the corresponding simulation result. (e) Dependence of the resonant wavelength dip shifts on temperature for the sensor with SP-SHSF lengths of 1.6, 2.0, and 2.2 mm.
    Fig. 5. Experimental setup and measurement result for temperature sensing. (a) Schematic diagram of the experimental setup. (b) Transmittance spectral response to the temperature changing from 25°C to 85°C for the sensors, with SP-SHSF length of 2.0 mm. (c), (d) Zoomed-in view of resonant wavelength dip shifts for the temperature changing from 40°C to 45°C in (b) and the corresponding simulation result. (e) Dependence of the resonant wavelength dip shifts on temperature for the sensor with SP-SHSF lengths of 1.6, 2.0, and 2.2 mm.
    Long-term stability of the PDMS-filled SP-SHSF sensor. Spectral response to temperature for the sample with SP-SHSF length of 1.6 mm on the (a) 1st, (b) 8th, (c) 15th, (d) 85th day, respectively. (e) Standard deviation of the wavelength at 30°C, 45°C, 60°C, and 75°C for 1 h. (f) Temperature sensitivities of the sensor for the 1st, 8th, 15th, and 85th test days.
    Fig. 6. Long-term stability of the PDMS-filled SP-SHSF sensor. Spectral response to temperature for the sample with SP-SHSF length of 1.6 mm on the (a) 1st, (b) 8th, (c) 15th, (d) 85th day, respectively. (e) Standard deviation of the wavelength at 30°C, 45°C, 60°C, and 75°C for 1 h. (f) Temperature sensitivities of the sensor for the 1st, 8th, 15th, and 85th test days.
    (a) Reversibility test of the proposed temperature sensor sample with SP-SHSF length of 1.6 mm. (b) Dependence of the dip shifts on temperature for the reversibility test; the error bar is smaller than the marker.
    Fig. 7. (a) Reversibility test of the proposed temperature sensor sample with SP-SHSF length of 1.6 mm. (b) Dependence of the dip shifts on temperature for the reversibility test; the error bar is smaller than the marker.
    Experiment of response time for temperature detection. (a) Sensor’s response characteristic under temperature changing from ∼22°C to ∼22.3°C. (b) Zoomed-in view variations to evaluate response and recovery times for the sensors.
    Fig. 8. Experiment of response time for temperature detection. (a) Sensor’s response characteristic under temperature changing from 22°C to 22.3°C. (b) Zoomed-in view variations to evaluate response and recovery times for the sensors.
    Monitoring human breath by using an as-fabricated wearable breath sensor. (a) Schematic of the experimental setup for human breath monitoring. (b) Volunteer to test human breathing speed with the proposed wearable breath sensor. (c) Image of the interior of the as-fabricated wearable breathing sensor. (d) Optical signal response of the sensor at different breathing frequencies. (e) Enlarged graph of response and recovery times of the sensor at different respiratory rates.
    Fig. 9. Monitoring human breath by using an as-fabricated wearable breath sensor. (a) Schematic of the experimental setup for human breath monitoring. (b) Volunteer to test human breathing speed with the proposed wearable breath sensor. (c) Image of the interior of the as-fabricated wearable breathing sensor. (d) Optical signal response of the sensor at different breathing frequencies. (e) Enlarged graph of response and recovery times of the sensor at different respiratory rates.
    (a) Transmittance spectral response to the relative humidity changing from 50% to 100% RH for PDMS-filled SP-SHSF sensors of 1.6 mm long sample at 25°C. (b) Dependence of the resonant wavelength dip shifts on the relative humidity for the proposed sensor.
    Fig. 10. (a) Transmittance spectral response to the relative humidity changing from 50% to 100% RH for PDMS-filled SP-SHSF sensors of 1.6 mm long sample at 25°C. (b) Dependence of the resonant wavelength dip shifts on the relative humidity for the proposed sensor.
    (a) Simulation transmission spectra of PDMS-filled SP-SHSF sensor with external environment refractive indices of 1–1.33. (b) Dependence of the resonant wavelength dip shifts on the external environment refractive index for the sensor.
    Fig. 11. (a) Simulation transmission spectra of PDMS-filled SP-SHSF sensor with external environment refractive indices of 1–1.33. (b) Dependence of the resonant wavelength dip shifts on the external environment refractive index for the sensor.
    Temperature Sensors StructureMechanismSensitive MaterialTemperature Range (°C)Sensitivity (nm/°C)Length (mm)Response Time (s)Figure of Merit [(nm/°C)/s]
    SP-SHSF (this work)ARPDMS25–854.2231.60.016263.94
    SMF+NCF+SMF [42]ARAcrylate25.15–38.5−3.7849.3N/AN/A
    Ring-shaped SMF-NCF [27]ARAcrylic resin20–30−5.098890.57
    SP-COF [43]MMIPDMS40–80−0.887N/AN/A
    CSPF [28]MMIPDMS30–85−0.440916N/AN/A
    HCF [26]SPRAg/alcohol35.5–70.1−1.16>15140.08
    SPF-MMF [17]SPRAu/graphene/PDMS40–80−1.56560.26
    uCACS [44]FPIPDMS46–5017.7580.14N/AN/A
    HC-PBGF [45]FPI100–6001.43.7N/AN/A
    FBG+metal tube [9]FBG0–350.0276150.04860.57
    Unpackaged-FBG [10]FBG20–900.0150.030210.33
    MCF [12]MI80 to 3500.03550.090.39
    MMMF [13]MZI38 to 350−0.19312N/AN/A
    MF-NCF-MF [46]MZI20–1000.0331N/AN/A
    Table 1. Comparison of the Performances of Various Types of Fiber Optic Temperature Sensors
    Zhibin Li, Ziye Wu, Zhuoqi Li, Liangxun Ou, Wenxiang Zhang, Zhicong Lai, Yu Zhang, Mengyuan Xie, Jieyuan Tang, Wenguo Zhu, Huadan Zheng, Yongchun Zhong, Xiong Deng, Xihua Zou, Zhe Chen, Jianhui Yu. High-sensitivity and fast-response fiber optic temperature sensor using an anti-resonant reflecting optical waveguide mechanism[J]. Photonics Research, 2023, 11(8): 1397
    Download Citation