1Key Laboratory of Optoelectronic Information and Sensing Technologies of Guangdong Higher Education Institutes, Department of Optoelectronic Engineering, Jinan University, Guangzhou 510632, China
2Guangdong Provincial Key Laboratory of Optical Fiber Sensing and Communications, Department of Optoelectronic Engineering, Jinan University, Guangzhou 510632, China
3Center for Information Photonics and Communications, School of Information Science and Technology, Southwest Jiaotong University, Chengdu 611756, China
Temperature sensing is essential for human health monitoring. High-sensitivity () fiber sensors always require long interference paths and temperature-sensitive materials, leading to a long sensor and thus slow response (6–14 s). To date, it is still challenging for a fiber optic temperature sensor to have an ultrafast () response simultaneously with high sensitivity. Here, a side-polished single-mode/hollow/single-mode fiber (SP-SHSF) structure is proposed to meet the challenge by using the length-independent sensitivity of an anti-resonant reflecting optical waveguide mechanism. With a polydimethylsiloxane filled sub-nanoliter volume cavity in the SP-SHSF, the SP-SHSF exhibits a high temperature sensitivity of 4.223 nm/°C with a compact length of 1.6 mm, allowing an ultrafast response (16 ms) and fast recovery time (176 ms). The figure of merit (FOM), defined as the absolute ratio of sensitivity to response time, is proposed to assess the comprehensive performance of the sensor. The FOM of the proposed sensor reaches up to , which is more than two to three orders of magnitude higher than those of other temperature fiber optic sensors reported previously. Additionally, a three-month cycle test shows that the sensor is highly robust, with excellent reversibility and accuracy, allowing it to be incorporated with a wearable face mask for detecting temperature changes during human breathing. The high FOM and high stability of the proposed sensing fiber structure provide an excellent opportunity to develop both ultrafast and highly sensitive fiber optic sensors for wearable respiratory monitoring and contactless in vitro detection.
1. INTRODUCTION
Accurate and fast temperature measurement plays a crucial role in human healthcare [1,2], biomedicine [3], animal husbandry [4], and mechanical engineering applications [5]. High-sensitivity temperature sensors are beneficial for achieving such high-precision temperature measurements, so they are widely studied. While conventional thermistors can achieve fast response time within 50 ms [6], fiber optic sensors have become more popular with the advantages of rapid response, small size, resistance to electromagnetic interference, and biological compatibility [7,8]. For example, the most typically used optical fiber temperature sensor is based on fiber Bragg grating (FBG), which can reach several millimeters of 5–15 mm and obtain a response time of 30.21–48.6 ms [9,10]. Unfortunately, the FBG always has a low-temperature sensitivity limit of [11], and as the length grows, the increased thermal capacity creates the chance for an extended response time. Additionally, fiber optic interferometers for temperature sensing have been developed. A multicore fiber (MCF)-based temperature sensor using mode interference displayed a sensitivity of 35 pm/°C with the length of 5 mm and obtained a response time of 90 ms [12]. The dual Mach–Zehnder interferometer (MZI) of the multimode microfiber structure can excite the interference between the core and cladding modes, and demonstrated a temperature sensitivity of with a total tapered length of 12 mm [13]. Although their varying structure designs can increase the sensitivity by growing the interference length, the above-mentioned sensors still have a limitation of temperature sensitivity () due to slight differences in the thermal optical coefficients (TOCs) between the silicon core and the cladding material.
In recent years, a large TOC material integrated into the sensor assembly has been used to improve sensitivity. For instance, Lu et al. demonstrated a surface plasmon resonance (SPR) temperature sensor based on a silver coating and liquid-crystal-filled structure. It obtained a temperature sensitivity of in the range of 20°C–34.5°C [14]. However, the addition of liquids can result in a narrow operating range, poor thermal repeatability, and slow response time (order of seconds). Hence, polydimethylsiloxane (PDMS) as a solid material has been widely used in various optical fiber temperature sensors due to its high thermal–optical coefficient () [15], high stability, low cost, and high biocompatibility. Yao et al. used PDMS-coated microfiber to achieve a temperature sensitivity of 1.2 nm/°C in the range of 25°C–95°C [16]. The high thermal conductivity properties of graphene, nanodiamonds (NDs), and other materials in combination with PDMS [17,18] have also been used to enhance sensitivity and improve the response time of temperature sensors, achieving a temperature sensitivity of and exhibiting a response time of 6 s. However, the transfer of multiple materials during fabrication still increases the chance of device instability, and the accompanying increase in size leads to greater thermal capacity and longer response time. There is a constraint relationship between sensor sensitivity and response time at a limited size.
An anti-resonant reflecting optical waveguide (ARROW), with a simpler fiber structure and the presence of leaky modes in the cladding making it sensitive to surrounding environments [19], has been extensively investigated in the past few years [20–23]. Particularly, specialty hollow-core fibers (HCFs) of silica capillaries with an air core structure and low transmission loss can be seen as a most straightforward ARROW sensing platform. Moreover, the micro-cavity in the air core can be filled with material and provide a fuller interaction between light and material, which helps achieve high sensitivity and ultra-compactness for fiber optic sensors [19,24,25]. The use of the HCF structure is a powerful strategy for breaking through the mutual constraints of sensitivity and response time.
Sign up for Photonics Research TOC. Get the latest issue of Photonics Research delivered right to you!Sign up now
In this paper, we demonstrate a single fiber optic temperature sensor using the ARROW mechanism to break the limitation, due to the sensitivity and length-independent effect of the sensor structure. The structure consists of a PDMS-filled side-polished single-mode/hollow/single-mode fiber (SP-SHSF). Since the refractive index (RI) of PDMS is lower than that of silica tubes, high-sensitivity ARROW can be achieved. The sensor has proven to be length independent in sensitivity, and temperature sensitivity up to 4.223 nm/°C was found at the sensor’s length compactness of only 1.6 mm with a sub-nanoliter volume PDMS cavity. The open surface of PDMS–air and its small size accelerates the thermal conversion rate, and the sensor shows an ultrafast response time of 16 ms and recovery time of 176 ms. Hence, we use the figure of merit (FOM) expressed as an absolute ratio of sensitivity to response speed to evaluate the overall performance of the sensor. The proposed sensor has a high FOM of , which is two to three orders higher than those of other fiber optic temperature sensors [9,10,12,17,26,27]. Furthermore, it has been long-cycle tested for three months for high robustness, excellent reversibility, and detection accuracy. As a proof of concept, it is used to detect the frequency change of human breathing. The measurement of the human respiratory rate with high sensitivity and ultrafast response speed (35 ms) has been realized. The combination of the proposed sensor structure with high FOM, length-independent sensitivity, flexibility, and high stability offers great potential for the development of fast response and sensitive wearable optical chips for human health monitoring.
2. SENSOR STRUCTURE AND SENSING PRINCIPLE
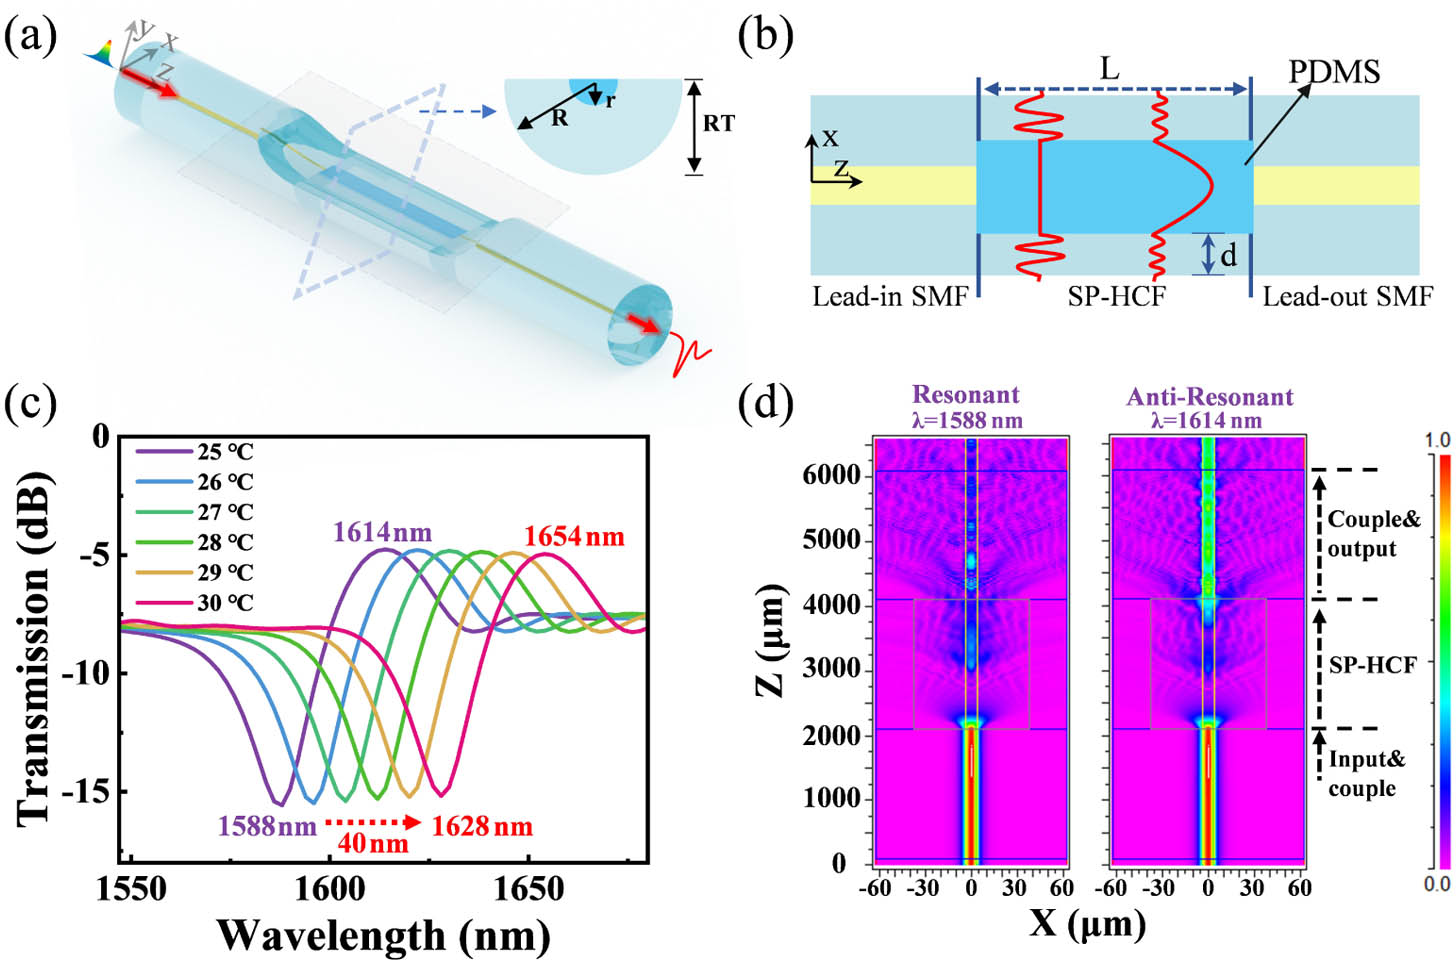
Figure 1(a) shows schematically the three-dimensional structure of the proposed temperature sensor. The PDMS-filled SP-SHSF was achieved by side-polishing a length of HCF until part of the air core was exposed and filling PDMS into the air groove of the D-shaped SP-SHSF. The residual thickness (RT) of side polished HCF (SP-HCF) can easily be decreased by prolonging the duration of the polishing process, which was fully investigated in our previous work [28,29]. As shown in Fig. 1(b), the section of the PDMS-filled SP-SHSF can work as an ARROW. The mechanism can be described as the light emitted in the SP-SHSF from the lead-in SMF; it will be reflected on the wall of the SP-HCF and propagate in a leakage mode. The beam propagation method (BPM, RSoft Synopsys Inc.) was employed to simulate the transmission spectra and field evolution of the PDMS-filled SP-SHSF to reveal the sensing mechanism. In the simulation, the inner diameter of the HCF, denoted as , is larger than the core diameter of SMF, denoted as , which is 8.2 μm. The cladding diameter of HCF and SMF, denoted as 2R, is 125 μm. The length of PDMS-filled SP-SHSF (L) is 2 mm. Here, the RT is set to 66.5 μm, ensuring that the core of SMF is not damaged and the D-shaped hollow core groove tube can form the largest opening area. So the PDMS solution could easily penetrate into the hollow core. The RIs of the core of SMF and the silica cladding are 1.4681 and 1.4628 [30], respectively. Figure 1(c) shows the simulated results of the sensors with a of 75 μm. It can be seen that the transmission spectra dip with a large redshift of 40 nm from 1588 to 1628 nm when the temperature increases from 25°C to 30°C (the corresponding decreases from 1.418992 to 1.416662). In addition, the transmission definition of is adopted in the simulations, where and are the input and output powers of the sensor, respectively. The expression of is used to calculate the RIs of the PDMS, where at a temperature of 22°C and the thermo-optic coefficient () is equal to [31]. Figure 1(d) shows the simulation result by using the BPM; the optical field evolutions are in vertical sections ( plane) along the PDMS-filled SP-SHSF structure with a temperature of 25°C at the dip wavelength of 1588 nm and peak wavelength of 1614 nm. The incident light propagates along the lead-in SMF with the fundamental mode, and is then refracted into the PDMS-filled cavity of the SP-SHSF. The pattern in the annular cladding of the capillary meets the condition of mode resonance [the silica cladding can be seen as a pair of Fabry–Perot (FP) etalons]; it leaks out of the cladding and results in a destructive interference at the core of the lead-out SMF. It can reveal the basic properties of the leakage mode resonance, such as the condition at 1588 nm, while the light guiding mechanism in the SP-SHSF filled with PDMS follows the ARROW model at 1614 nm.
Figure 1.(a) Schematic diagram of the proposed temperature sensor. (b) Guiding mechanism of the proposed PDMS-filled SP-SHSF temperature sensor. (c) Simulated transmission spectra of the sensors with the temperature increase from 25°C to 30°C. (d) Field evolution along the vertical cross section ( plane) of the PDMS-filled SP-SHSF structure at a temperature of 25°C for resonance and anti-resonance wavelengths.
The redshift of the resonance wavelength in the transmission spectrum is due to the temperature-induced RI change of PDMS. Assuming the ARROW model guides the light, the resonance wavelength can be calculated using the following equation [32]: where is the cladding thickness of HCF; and are the RIs of the PDMS-filled cavity and silica cladding of the SP-HCF, respectively; is the resonant order.
The free spectral range (FSR) is an important criterion for evaluating the inverse resonance effect. The calculation formula of FSR can be expressed as [19,33] where and are the wavelengths of two adjacent resonant peaks.
According to Eq. (1), we can derive the sensitivity of the proposed PDMS-filled SP-SHSF temperature sensor to temperature. Considering that the thermo-optic effect has a greater contribution than thermal expansion in the studied configuration, the PDMS thermo-optic coefficient is three orders of magnitude higher than the thermal expansion coefficient of pure silica () at 20°C [34,35]. The thermal expansion of a silica capillary is not the dominant factor and can be neglected. Therefore, the wavelength shift sensitivity can be approximated as follows: and substituting into Eq. (3) and neglecting the quadratic coefficients of the , we can obtain the sensitivity of Eq. (3) as
From Eq. (4), it can be deduced that temperature sensitivity is determined by the PDMS’s thermo-optic coefficient , the HCF’s cladding thickness , and the resonant wavelength . As a result, the sensitivity when is negative, corresponding to a redshift of the resonant wavelengths with an increase in temperature. It is equivalent to the redshift of the resonant wavelength trough with the temperature rise. It also reveals that the sensor possesses a length-independent temperature sensitivity characteristic, which provides a theoretical basis for making miniaturized optical chips without scaling down performance.
To demonstrate the anti-resonant guidance mechanism, the BPM simulated transmission spectra and the dispersion curves for the proposed PDMS-filled SP-SHSF structure were analyzed by the commercial finite element software COMSOL Multiphysics, as shown in Fig. 2. In the simulation, using parameters of HCF inner diameters and lengths of 30 μm and 2 mm, the RT of SP-HCF and the RI of PDMS are 66.5 μm and 1.412, respectively. In Fig. 2(a), points A–I are marked with the corresponding wavelengths of the modes in Fig. 2(c), respectively. The dispersion curves of , , , and modes (number of oscillations in the cladding region is denoted as N, corresponding to 25, 24, 23, and 22, respectively) in the wavelength range of 1440–1700 nm and corresponding electric field distributions of points A–I are illustrated in Figs. 2(b) and 2(c). From Fig. 2(b), the curves show periodic dispersion bands; among them, the region where the effective RI changes drastically corresponds to the resonant band (highlighted in orange), while the flat changes region corresponds to the AR band (highlighted in blue). The width of the two resonant bands is consistent with the FSR of the AR mechanism. Therefore, it can be demonstrated that the sensing mechanism of our proposed PDMS-filled SP-SHSF structure is dominated by the AR effect. From Fig. 2(c), the energy is concentrated at the PDMS core, while the crossing of the guiding mode between the core and cladding causes destructive interference to bounce back to the core mode, and the modal field profile is shown as points D and G. This phenomenon corresponds to the intensity change with the transmission spectrum, and it can explain that even if one side of the HCF fiber is polished, the transmission spectrum still maintains a lower loss.
Figure 2.(a) Simulated transmission spectra for the proposed PDMS-filled SP-SHSF structure with HCF inner diameters of 30 μm and length of 2.0 mm (b) Dispersion curves of the proposed sensor structure. (c) Electric field vector distributions of the PDMS-filled SP-HCF.
To further validate the sensing mechanism, the transmission properties of the proposed PDMS-filled SP-SHSF structures with different air core diameters and HCF lengths were theoretically investigated using BPM for the three types of samples with different HCF core diameters of 20–75 μm and HCF lengths extending from 1.0 to 2.5 mm. The simulated transmission spectra are shown in Figs. 3(a)–3(c). Periodic transmission dips with fixed central wavelengths are excited with the different lengths of HCF. Considering that the length of HCF can have a critical value, the FP interference and AR mechanism can coexist. If the length of HCF is far beyond the critical length, the AR mechanism plays a leading role. Therefore, the comparison of the simulated and formula [Eq. (2)] calculated results for FSR with different HCF core diameters and lengths of HCF in the same range of resonance wavelength is displayed in Fig. 3(d). The critical length is denoted as when the AR appears, and its analytical expression is approximated by the following equation [36]:
As can be seen from Fig. 3(d), the simulated FSR between two adjacent transmission dips (highlighted in gray) is almost the same as the equation calculated when the length of HCF is extended from 1 to 2.5 mm (greater than the of 507.58 μm) with the inner diameter of 20 μm. The same pattern happens in the HCF with the diameter of 30 μm (highlighted in pink). Thus, it is confirmed that the ARROW guiding mechanism introduces those periodic dips. In addition, with the increase of the inner diameter from 20 to 75 μm, the wall thickness decreases, which leads to the FSR increase of the resonant wavelength dip, which is in good agreement with the AR effect. Notably, the is longer at a larger hollow core diameter ; the difference of FSR between the simulated and formula calculated is at a maximum of about 15 nm when the length of the HCF is 1 mm, but diminishes to 0.84 nm with 2.5 mm length of the HCF [highlighted in blue in Fig. 3(a)]. It can be explained that the AR effect gradually becomes dominant as the length of HCF moves away from the critical position. With the increase of the HCF length, some tiny drops appear, probably introduced by the multimode interference (MMI) effect. Multiple modes propagate along the PDMS-filled air cavity of the SP-SHSF and interfere with each other, resulting in MMI. The PDMS–air interface also reflects the guiding light, but reflection satisfies the generalized Snell’s law, which results in a total reflection effect and enhanced sensitivity to the surrounding environment. In addition, the flat connection method makes the light wave fully incident into the PDMS without being reflected by the polished surface. This helps to enhance the strong interaction between the light field and the PDMS material, and improves the sensitivity of the temperature. In addition, filling PDMS materials with a higher RI than air could reduce the Fresnel reflection and leakage loss.
Figure 3.Simulated transmission spectra for the proposed PDMS-filled SP-SHSF structure with different HCF core diameters and lengths of HCF: (a) 20 μm, (b) 30 μm, (c) 75 μm. (d) Comparison of the simulated and formula calculated results for FSR with different HCF core diameters and HCF lengths in the same resonance wavelength range.
It is worth noting that the transmission spectrum is not particularly uniform but appears to include other periodic components distributed throughout the AR region of the transmission spectrum, and different transmission spectrum visibilities of the three types of samples can be observed, possibly due to the accumulation of the resonance effect and MMI effect at the resonance wavelength along the length of SP-SHSF.
Therefore, there is a trade-off between transmission spectrum visibility and transmission loss. To avoid the introduction of the MZI effect caused by the collapse of the silica tube when splicing with SMF, and to shun the cross talk of the FP effect when the length for HCF is close to and achieve a relatively low transmission loss, under comprehensive consideration, HCF with an inner diameter of 30 μm and a length of 1.5 mm to 2 mm is recommended for the experiments.
3. EXPERIMENT
The proposed sensor used in the experiment can be fabricated by the schematic diagram as shown in Fig. 4. The first step is to splice a sandwich-like fiber optic structure of SMF-HCF-SMF (SHSF) using the flat connection method as shown in Fig. 4(a). The process is implemented by manually splicing a specific length of HCF (Gootyo, THCCF_PSC30) between two standard SMFs (Corning, SMF-28e). The inner radius of the HCF is selected as 15 μm, and other fiber parameters are consistent with the simulation. It is worth noting that the fiber centers of both splicing points were manually aligned on a welding machine (DVP-740), optimizing the arc current and duration and keeping the discharge electrode offset from one side of the SMF to ensure the flatness of the welded surface. Figure 4(b) shows the SHSF sample with a section of 2 mm long HCF spliced between two SMFs (notice the red signal mark at the fusion point of SMF/HCF, which is used to assist in determining the cut length of the HCF, since the fusion point is difficult to see without the help of a microscope). The flat connection between SMF and HCF can be seen in the inset of Fig. 4(b). The next step is to adopt the grinding wheel polishing technology [29] to fabricate the SP-SHSF sample. The self-made polishing system is shown in Fig. 4(c). Two fiber clampers fixed the SHSF to keep it straight, and against the grinding wheel, a desired polished depth of the SP-SHSF sample is achieved by controlling the rotation speed and time of the wheel. Note that the SHSF sample needs to be cleaned after the side polishing process. The cleaning process includes: soaking the sample in “piranha solution” (70% and 30% ) for 30 min at room temperature [37], then rinsing the sample with plenty of deionized water, and drying it at 60°C for 20 min. This step is to hydroxylate and clean the silica surface in the SP-SHSF groove, making it highly hydrophilic and thus ensuring that PDMS can be filled without any air gaps. The top view image of the SP-SHSF sample after the side polishing process is shown in Fig. 4(d). Third, the prepared SP-SHSF structure was fixed on the slide with high-temperature tape to enhance its firmness and keep the groove direction of the SP-SHSF structure facing up. The PDMS solution is made by mixing two precursors of elastic material (Sylgard 184-A) and hardener (Sylgard 184-B) with a ratio of 10:1, and the specific preparation process can be found in our previous work [28]. The prepared PDMS solution was dropped using a pipette gun, and the excess PDMS over the groove surface could be scraped off with a clean SMF, which can be done for several times under the microscope until the fiber surface is flat with no excess PDMS solution. The operation diagram is shown in Fig. 4(e). Finally, the prepared SP-SHSF sample filled with PDMS solution was cured at 80°C for 15 min. When the PDMS is cured and solidified, the proposed PDMS-filled SP-SHSF temperature sensor is fabricated successfully, and the sample is shown in Fig. 4(f). The inset in Fig. 4(f) shows the cross section of the sample with the RT of 70 μm.
Figure 4.Schematic of SP-SHSF fabrication process. (a), (b) Splicing two sections of SMFs with HCF and diagrams after splicing, respectively. (c) Grinding system. (d) Top view image of the SP-SHSF sample after side polishing. (e) Dropwise PDMS. (f) Side view of the proposed sensor.
Figure 5(a) illustrates schematically the experimental setup used to investigate the PDMS-filled SP-SHSF temperature sensing characteristics. In the experiment, the lead-in and lead-out SMFs were fixed and suspended horizontally in a temperature-controlled chamber using ultraviolet (UV) glue (Norland Optical Adhesive 65). The lead-in SMF at the leading end of the fiber is connected to a supercontinuum light source (SCS, YSLSC-5-CFS) with a wavelength range of 450–2400 nm and a peak power of 9 dBm at 1064 nm. The lead-out SMF of the fiber is connected to the optical spectrum analyzer (OSA, Yokogawa, AQ6370D) with a resolution of 20 pm. In addition, a commercial thermometer is connected to monitor the internal temperature, and the temperature data are recorded by computer in real time. A sample of the temperature sensor is shown in the enlarged inset of Fig. 5(a). In the temperature test process, the temperature of the chamber is set to be increased by a step from 25°C to 85°C and held for 10 min in each step to obtain a stable transmission spectrum of the sensor. The transmittance spectral response to the temperature changing from 25°C to 85°C for the sensors, with the SP-SHSF length of 2 mm, is shown in Fig. 5(b). Figure 5(c) shows the tracked resonance dip spectral offset at 40°C and 45°C, and a large wavelength dip redshift of 21.8 nm is obtained. By comparing the corresponding simulation result in Fig. 5(d), the wavelength dip redshift obtained in the numerical calculation is 28 nm, which shows the corresponding resonance effect and confirms the high consistency between the experimental and simulated results. The difference in the wavelength dip redshift can be interpreted as the slight collapse of the silica capillary during the sample fusion process, the PDMS–air interface’s flatness, and the RT measurement error. The dependence of the resonant wavelength valley shifts on the temperature of three different samples with SP-SHSF lengths of 1.6, 2.0, and 2.2 mm, is shown in Fig. 5(e). By linearly fitting the wavelength valley redshifts with temperature, the temperature sensitivity increases from 3.740 to 3.826 and 4.098 nm/°C when the SP-SHSF length decreases from 2.2 to 2.0 and 1.6 mm. All linear correlation coefficients are greater than 99.6%, indicating that the wavelength valley shifts with the change of temperature have an excellent linear relationship. It is shown that the higher sensitivity can be achieved at a shorter length of 1.6 mm SP-SHSF with the 30 μm inner diameter for HCF, which can contribute to the transmission loss of the leakage mode by ARROW. According to the ARROW length-independent feature of the temperature sensitivity in Eq. (4), using a thinner cladding with a shorter length of HCF makes it possible to fabricate highly sensitive temperature sensors with micrometer dimensions.
Figure 5.Experimental setup and measurement result for temperature sensing. (a) Schematic diagram of the experimental setup. (b) Transmittance spectral response to the temperature changing from 25°C to 85°C for the sensors, with SP-SHSF length of 2.0 mm. (c), (d) Zoomed-in view of resonant wavelength dip shifts for the temperature changing from 40°C to 45°C in (b) and the corresponding simulation result. (e) Dependence of the resonant wavelength dip shifts on temperature for the sensor with SP-SHSF lengths of 1.6, 2.0, and 2.2 mm.
B. Long-Term Stability and Reversibility of the Sensor
To further illustrate the long-term stability and repeatability of the sensor, we conducted a long-term tracking test on the above highly sensitive sample for the SP-SHSF length of 1.6 mm. In addition, the experimental devices were placed indoors without encapsulation or sealing measures to meet the normal environmental conditions of the test. Figures 6(a)–6(d) show the two-dimensional intensity diagram of the temperature response of the sample measured for the first time and after 7, 14, and 84 days, respectively. The trends of the four tests are consistent over the same wavelength range marked by the red dash. After 84 days of placement, tracks and records shift in the valley of the transmission spectrum of the sample every 5 min for 1 h on each temperate condition (30°C, 45°C, 60°C, and 75°C). The average standard deviation of is obtained, as shown in Fig. 6(e). In addition, Fig. 6(f) shows that the sensitivities from the four repeated tests (from the first day to the 85th day) are 4.098, 4.05, 4.223, and 4.135 nm/°C. The test results show that the resonance wavelength of the device at 85°C was shifted only 3 nm from the first day to the 85th day. Moreover, considering the stability of the temperature control furnace, we can conclude that the sensor has excellent long-term stability and repeatability.
Figure 6.Long-term stability of the PDMS-filled SP-SHSF sensor. Spectral response to temperature for the sample with SP-SHSF length of 1.6 mm on the (a) 1st, (b) 8th, (c) 15th, (d) 85th day, respectively. (e) Standard deviation of the wavelength at 30°C, 45°C, 60°C, and 75°C for 1 h. (f) Temperature sensitivities of the sensor for the 1st, 8th, 15th, and 85th test days.
The reversibility of temperature tests is a significant performance for the high-sensitivity temperature sensor. We also selected the used SP-SHSF length of a 1.6 mm temperature sensor sample after 84 days for the reversibility experiment as shown in Fig. 7(a); the dynamic wavelength shifts with temperature increasing and decreasing gradually between 25°C and 85°C in steps of 5°C. Preliminary data show a robust performance, in which the wavelength of the sensor is consistent with the response trend of the actual temperature. The temperature linear fitting curves are shown in Fig. 7(b), and each point is the average of each stabilized step obtained from Fig. 7(a). The result shows that temperature sensitivities of heating and cooling are 4.135 and 4.116 nm/°C within the correlation coefficients of 0.9988 and 0.9989, respectively. Referring to previous work mentioning the “relative sensitivity deviation” as a criterion to assess the reversibility of the temperature sensor [28], we can obtain a high reversibility of for the proposed sensor. Then, combined with the maximum sensitivity of temperature detection, the detection accuracy of the sensor in the test range of 25°C–85°C is 0.0237°C, which has reached the detection magnitude of the electronic thermometer. It is worth noticing that such PDMS-filled SP-SHSF can have a neglectable hysteresis to ambient temperature, excellent stability, and high reversibility, which are the most desirable characteristics in practical applications.
Figure 7.(a) Reversibility test of the proposed temperature sensor sample with SP-SHSF length of 1.6 mm. (b) Dependence of the dip shifts on temperature for the reversibility test; the error bar is smaller than the marker.
The rapid temperature response is a crucial characteristic of the PDMS-filled SP-SHSF sensor, which can be obtained by monitoring the corresponding time of optical signal variations. A communication wavelength laser (1550 nm) source is used to transmit the laser into the SMF as the input port of the sensor. Because of the spectrometer’s low scanning spectral recording speed (), it is unsuitable for fast speed recording of the order of milliseconds. Therefore, the output optical signal was detected by a photodetector (PD, New Focus, 2011-FS-M) with 100 kHz bandwidth and displayed with an oscilloscope (OSC). The function of the PD is to convert the change of output optical power caused by respiration into an electrical signal. As shown in Fig. 8(a), by blowing hot air into the sensor quickly and regularly at room temperature of , the light signal changes periodically with the rhythm of heat exchange. Through synchronous testing with commercial temperature probes, the temperature near the sensor can be increased by nearly 0.3°C () when hot air is blown in. The decay time of the curve was fitted using the exponential, and the time required for the sensor output signal to rise from 10% to 90% of the steady value is used as the time response of the sensor [38]. As illustrated in Fig. 8(b), the PDMS-filled SP-SHSF sensor samples with a length of 1.6 mm and volume of the cavity achieved ultrafast temperature response and recovery times of 16 and 176 ms, respectively. In addition, numerical simulations have been performed to confirm that a PDMS-filled SP-HCF structure with the length of 1.6 mm can achieve faster temperature conductivity, with a 30% reduction in conduction time compared to the PDMS-filled HCF without a polished side cladding. The performance of the sensor with an ultrafast response time without additional high thermal conductivity materials (such as the NDs of 2200 W/mK [39]) can be attributed to the ultra-compact size of the sensor and the open surface of PDMS–air. The response time () of the temperature sensor can be expressed as [40] , where , , and , are density, heat capacity, and volume of the medium, respectively. The heat transfer coefficient and the surface area are denoted as and , respectively. The rapid response time of the proposed sensor can be attributed to the reduced heat capacity and volume with its shorter length, larger surface to volume ratio, and thus faster heat exchange. By utilizing the ARROW mechanism for achieving length-independent temperature sensitivity, the proposed sensor structure is expected to simultaneously enable the development of high-sensitivity temperature sensors with micrometer dimensions and ultrafast response times (∼milliseconds).
Figure 8.Experiment of response time for temperature detection. (a) Sensor’s response characteristic under temperature changing from to . (b) Zoomed-in view variations to evaluate response and recovery times for the sensors.
Combining the advantages of the PDMS-filled SP-SHSF sensor of a compact size, high sensitivity, high stability, reliability, good flexibility, and ultrafast response speed, the sensor has great potential in making wearable medical or biological detection devices. Here, we exhibited an as-fabricated wearable breath sensor for monitoring human breathing speed, as shown in Fig. 9. Figures 9(a)–9(c) show the schematic of the experimental setup, a volunteer to test human breathing speed with the proposed wearable breath sensor, and the detail of the interior of the as-fabricated sensor. In the test, the same 1550 nm wavelength laser is used to transmit light into the input port of the sensor, and the output SMF is connected to a PD. Then the electrical signal is transmitted to the OSC, and the real-time monitoring of respiratory frequency can be realized. Figure 9(d) shows the volunteers taking a breath test with three different breathing states. During exhalation, the signal voltage rises sharply with the rapidly increased temperature and RH in the mask. During inhalation, the signal voltage decreases fast until recovering to the original strength of the signal. In addition, the internal RH of the mask will approach equilibrium, and the internal temperature difference will decrease with changes in breathing, which can explain the gradual increase of the original strength of the signal, as shown in the fast breath test of Fig. 9(d). In Fig. 9(e), the wearable breath sensor’s fastest response and recovery times are 35 and 280 ms, respectively.
Figure 9.Monitoring human breath by using an as-fabricated wearable breath sensor. (a) Schematic of the experimental setup for human breath monitoring. (b) Volunteer to test human breathing speed with the proposed wearable breath sensor. (c) Image of the interior of the as-fabricated wearable breathing sensor. (d) Optical signal response of the sensor at different breathing frequencies. (e) Enlarged graph of response and recovery times of the sensor at different respiratory rates.
It is easy to observe that the measured respiratory rate corresponds to the temperature response rate. The RH within the mask tends to balance with continuous breathing; we can assume that the optical signal response of the respiratory sensor mainly results from the temperature change (the effect of humidity on the sensor can be found in the Appendix A). The recovery time is longer than the response time and can be explained by the temperature slowly changing due to the relatively closed conditions inside the mask. This phenomenon can be seen from the deep breathing test in Fig. 9(e), where the rate of temperature change in the mask slows down as the exhalation time increases, which results in a double recovery time of 620 ms. The recovery speed was restored to 280 ms when switched to a fast breathing state. It is concluded that the as-fabricated wearable breath sensor can perform very well in monitoring breathing speed. The highest breath frequency can reach about 2 Hz, and can monitor the respiratory rate even when the person is running [41].
E. Performance Comparison of the Sensors
Table 1 compares several typical fiber optic temperature sensors to demonstrate the exceptional performance of the PDMS-filled SP-SHSF sensors. It is shown that fiber optic temperature sensors based on different mechanisms of mode interference (MI), FBG, and MZI have response times between 30.21 and 90 ms without material addition, but all the sensitivities less than 0.1 nm/°C [9,10,12,46]. Temperature sensors based on the FP interference (FPI) effect and Vernier effect have been reported to achieve higher sensitivities of to 17.758 nm/°C, but the response time is uninvestigated [44,45]. The PDMS-filled SP-SHSF sensor achieves a temperature sensitivity up to 4.223 nm/°C in the range of 25°C–85°C, which is more than two to three orders higher than some sensors without material and maintains an ultrafast response rate (16 ms) and at least 4.79 times higher sensitivity than MMI mechanism-based sensors using PDMS materials [28,43]. This demonstrates that it is possible to maintain a fast response time at a shorter length (1.6 mm) with a sub-nanoliter volume cavity while guaranteeing a high temperature sensitivity due to the length-independent role of the ARROW mechanism for sensitivity. Other material-based optical sensors such as acrylate [42], acrylic resin [27], PDMS [28,43], Ag/alcohol [30], and Au/graphene/PDMS [17] can reach a temperature sensitivity from to , but with a more complex preparation process, larger structure length, and longer response time.
Comparison of the Performances of Various Types of Fiber Optic Temperature Sensors
Temperature Sensors Structure
Mechanism
Sensitive Material
Temperature Range (°C)
Sensitivity (nm/°C)
Length (mm)
Response Time (s)
Figure of Merit
SP-SHSF (this work)
AR
PDMS
25–85
4.223
1.6
0.016
263.94
SMF+NCF+SMF [42]
AR
Acrylate
25.15–38.5
−3.784
9.3
N/A
N/A
Ring-shaped SMF-NCF [27]
AR
Acrylic resin
20–30
−5.098
8
9
0.57
SP-COF [43]
MMI
PDMS
40–80
−0.88
7
N/A
N/A
CSPF [28]
MMI
PDMS
30–85
−0.4409
N/A
N/A
HCF [26]
SPR
Ag/alcohol
35.5–70.1
−1.16
14
0.08
SPF-MMF [17]
SPR
Au/graphene/PDMS
40–80
−1.56
6
0.26
uCACS [44]
FPI
PDMS
46–50
17.758
N/A
N/A
HC-PBGF [45]
FPI
100–600
N/A
N/A
FBG+metal tube [9]
FBG
0–35
0.0276
15
0.0486
0.57
Unpackaged-FBG [10]
FBG
20–90
5
0.03021
0.33
MCF [12]
MI
to 350
5
0.09
0.39
MMMF [13]
MZI
to 350
−0.193
12
N/A
N/A
MF-NCF-MF [46]
MZI
20–100
0.033
1
N/A
N/A
To evaluate the sensor’s overall performance, we used the FOM, defined as the absolute ratio of the sensitivity to the response time in . Most reported fiber optic temperature sensors cannot have both high sensitivity and fast response because a longer interference path and high TOC materials can improve the sensitivity of the sensor, but the response time becomes longer due to the increased heat capacity and lower thermal diffusivity as the device structure size becomes larger. To break the limitations, we implemented a novel SP-SHSF sensor structure with an AR sensing mechanism, which can reduce the length and volume of the structure and increase the area by the open surface of PDMS–air while ensuring high sensitivity and obtaining a fast response at the same time. As shown in the last column of Table 1, the FOM of this work can reach , which is more than two to three orders of magnitude higher than those of other reported temperature fiber optic sensors.
5. CONCLUSIONS
In summary, a novel temperature sensor with a single fiber optic PDMS-filled SP-SHSF structure using an ARROW mechanism is proposed and fabricated. High-sensitivity ARROW can be easily achieved due to the lower RI of PDMS than that of silica tubes. Due to the structure of high sensitivity and length-independent sensitivity, it is a powerful strategy to simultaneously obtain high sensitivity and fast response and achieve a high FOM. Experimental results show that the temperature sensitivity of the sensor reaches 4.223 nm/°C at a length of 1.6 mm with a PDMS-filled sub-nanoliter volume cavity, while response and recovery times are as short as 16 and 176 ms, due to the compact size and length-independent characteristics of the sensitivity. The embodied FOM reaches , which is more than two to three orders of magnitude higher compared to other reported temperature sensors. The sensor exhibits excellent reversibility performance with a long-cycle test over three months, which verifies the reliability, low relative sensitivity deviation of , and detection accuracy of 0.0237°C. Owing to the above advantages, a wearable face mask integrated with a fiber optic sensor is demonstrated to detect human breathing and measure breath response speed up to 35 ms. Given the advantages of the high FOM, length-independent sensitivity, flexibility, and high stability of the proposed sensing structure, we believe this work will be essential in developing high-frequency high-sensitivity optical chips for future wearable respiratory health and contactless in vitro testing, and provides a highly sensitive nanoliter sensor platform for potentially wide sensing applications in biology.
APPENDIX A: EFFECT OF HUMIDITY ON THE SENSOR
To evaluate the humidity stability of the PDMS-filled SHSF temperature sensor, the resonant wavelength of the sensor was tracked under different humidity conditions. The humidity is controllable by a humidity test chamber (BPS-100CL, Yiheng, China) and monitored by a commercial humidity/thermometer (175H1, Testo). The experiment is conducted in the chamber at a constant temperature of 25°C; the RH is tuned in an auto manner, which increases from 50% to 75% RH at a step of 5% RH, and then each RH step is held for 15 min to obtain a stable transmittance spectrum of the sensor. The transmittance spectral response test results of the RH changing from 50% to 75% RH for the proposed sensors are plotted in Fig. 10(a). From Fig. 10(b), the resonance wavelength shift shows the linear correlation () to the RH, which has a sensitivity of 0.16 nm/%RH. The reason for the sensor exhibiting the dependent response to RH is that moisture can penetrate the PDMS over a range of temperatures and humidities, leading to the change of RIs for PDMS [47]. The humidity cross-sensitivity is only about 0.038°C/%RH, which indicates that the humidity has a negligible effect on the sensor’s sensitivity.
Figure 10.(a) Transmittance spectral response to the relative humidity changing from 50% to 100% RH for PDMS-filled SP-SHSF sensors of 1.6 mm long sample at 25°C. (b) Dependence of the resonant wavelength dip shifts on the relative humidity for the proposed sensor.
Figure 11.(a) Simulation transmission spectra of PDMS-filled SP-SHSF sensor with external environment refractive indices of 1–1.33. (b) Dependence of the resonant wavelength dip shifts on the external environment refractive index for the sensor.