• Photonics Research
  • Vol. 7, Issue 11, 1345 (2019)
Atri Halder1、*, Vytautas Jukna2, Matias Koivurova3, Audrius Dubietis2, and Jari Turunen1
Author Affiliations
  • 1Department of Physics and Mathematics, University of Eastern Finland, FI-80101 Joensuu, Finland
  • 2Laser Research Center, Vilnius University, LT-10223 Vilnius, Lithuania
  • 3Photonics Laboratory, Physics Unit, Tampere University, FI-33101 Tampere, Finland
  • show less
    DOI: 10.1364/PRJ.7.001345 Cite this Article Set citation alerts
    Atri Halder, Vytautas Jukna, Matias Koivurova, Audrius Dubietis, Jari Turunen. Coherence of bulk-generated supercontinuum[J]. Photonics Research, 2019, 7(11): 1345 Copy Citation Text show less
    Evolution of the output pulse intensity and spectral density at the center of the beam as a function of pump pulse energy. (a), (c), (e) Temporal intensity and (b), (d), (f) spectral density. Here (a), (b) correspond to 800 nm, (c), (d) to 1300 nm, and (e), (f) to 2000 nm pump pulses.
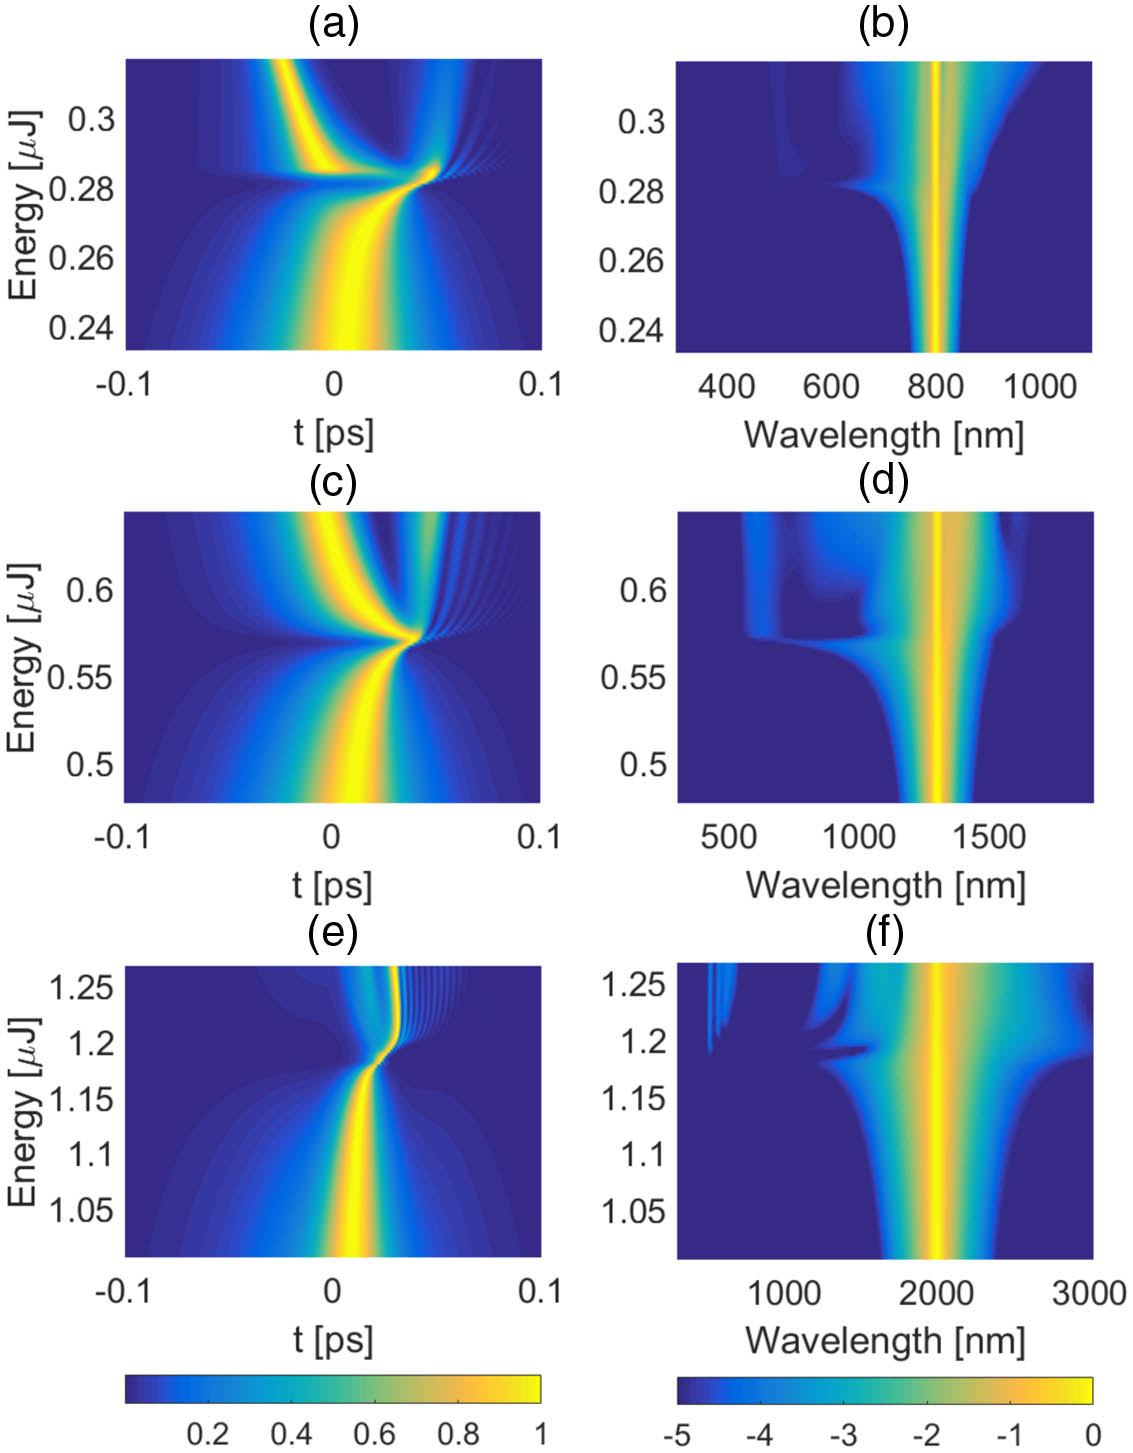
    Fig. 1. Evolution of the output pulse intensity and spectral density at the center of the beam as a function of pump pulse energy. (a), (c), (e) Temporal intensity and (b), (d), (f) spectral density. Here (a), (b) correspond to 800 nm, (c), (d) to 1300 nm, and (e), (f) to 2000 nm pump pulses.
    Evolutions of beam radius over propagation distance for pulses with central wavelengths of 800 nm (blue), 1300 nm (green), and 2000 nm (red), having input energies of 0.282 μJ, 0.569 μJ, and 1.175 μJ, respectively.
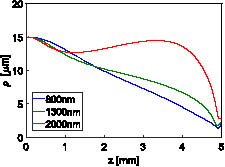
    Fig. 2. Evolutions of beam radius over propagation distance for pulses with central wavelengths of 800 nm (blue), 1300 nm (green), and 2000 nm (red), having input energies of 0.282 μJ, 0.569 μJ, and 1.175 μJ, respectively.
    (a), (c), (e) Spatiotemporal intensity profiles of the pulses at the exit plane of a crystal and (b), (d), (f) corresponding spatial frequency-resolved spectra. Subplots (a), (b) correspond to 800 nm, (c), (d) to 1300 nm, and (e), (f) to 2000 nm pump wavelengths, having input energies of 0.282 μJ, 0.569 μJ, and 1.175 μJ, respectively.
    Fig. 3. (a), (c), (e) Spatiotemporal intensity profiles of the pulses at the exit plane of a crystal and (b), (d), (f) corresponding spatial frequency-resolved spectra. Subplots (a), (b) correspond to 800 nm, (c), (d) to 1300 nm, and (e), (f) to 2000 nm pump wavelengths, having input energies of 0.282 μJ, 0.569 μJ, and 1.175 μJ, respectively.
    Absolute values of normalized degrees of coherence. Spatial degrees of temporal coherence at (a) ρ=0 and (b) ρ=0.018 mm. Angular degrees of spectral coherence at (c) κ=0 and (d) κ=300 mm−1. Red curves show temporal pulse amplitude profiles in (a) and (b), and spectral amplitude profiles in (c) and (d).
    Fig. 4. Absolute values of normalized degrees of coherence. Spatial degrees of temporal coherence at (a) ρ=0 and (b) ρ=0.018  mm. Angular degrees of spectral coherence at (c) κ=0 and (d) κ=300  mm1. Red curves show temporal pulse amplitude profiles in (a) and (b), and spectral amplitude profiles in (c) and (d).
    Overall degrees of coherence at the exit plane, plotted as functions of spatial position ρ (left, red) and spatial frequency κ (right, red) together with the corresponding normalized field intensity distribution (blue) integrated over time (Ft) and integrated over wavelengths (Fs). The pump wavelength is 800 nm for the upper row, where we have considered pump energies just below the threshold at 0.277 μJ (solid), at threshold 0.280 μJ (dashed), and just above threshold 0.282 μJ (dotted). Similarly, for the 1300 nm pump wavelength in the middle row, the energies are 0.565 μJ (solid), 0.567 μJ (dashed), and 0.569 μJ (dotted), and at 2000 nm in the bottom row, they are 1.173 μJ (solid), 1.175 μJ (dashed), and 1.18 μJ (dotted). Note that the horizontal axes in the left column have different scales.
    Fig. 5. Overall degrees of coherence at the exit plane, plotted as functions of spatial position ρ (left, red) and spatial frequency κ (right, red) together with the corresponding normalized field intensity distribution (blue) integrated over time (Ft) and integrated over wavelengths (Fs). The pump wavelength is 800 nm for the upper row, where we have considered pump energies just below the threshold at 0.277 μJ (solid), at threshold 0.280 μJ (dashed), and just above threshold 0.282 μJ (dotted). Similarly, for the 1300 nm pump wavelength in the middle row, the energies are 0.565 μJ (solid), 0.567 μJ (dashed), and 0.569 μJ (dotted), and at 2000 nm in the bottom row, they are 1.173 μJ (solid), 1.175 μJ (dashed), and 1.18 μJ (dotted). Note that the horizontal axes in the left column have different scales.
    Comparison between the spectral density distributions taken at particular spatial frequencies κρ (blue) and at corresponding real diffraction angles θ (red). Pump wavelength is 1300 nm. (a) θ=0.32°, κρ=26 mm−1. (b) θ=1.78°, κρ=150 mm−1. (c) θ=3.60°, κρ=300 mm−1.
    Fig. 6. Comparison between the spectral density distributions taken at particular spatial frequencies κρ (blue) and at corresponding real diffraction angles θ (red). Pump wavelength is 1300 nm. (a) θ=0.32°, κρ=26  mm1. (b) θ=1.78°, κρ=150  mm1. (c) θ=3.60°, κρ=300  mm1.
    Comparison between the overall degree of coherence as a function of spatial frequency (νκ, blue line), and as a function of real diffraction angle (νθ, red crosses) calculated from the spatial frequency component at 1300 nm.
    Fig. 7. Comparison between the overall degree of coherence as a function of spatial frequency (νκ, blue line), and as a function of real diffraction angle (νθ, red crosses) calculated from the spatial frequency component at 1300 nm.
    Overall degrees of temporal coherence calculated for pump energies well above the SC generation threshold: 0.31 μJ at 800 nm, 0.65 μJ at 1300 nm, and 1.25 μJ at 2000 nm. The notations are the same as in Fig. 5.
    Fig. 8. Overall degrees of temporal coherence calculated for pump energies well above the SC generation threshold: 0.31 μJ at 800 nm, 0.65 μJ at 1300 nm, and 1.25 μJ at 2000 nm. The notations are the same as in Fig. 5.
    λ (μm)80013002000
    n01.761.751.73
    g (fs2/mm)+58.1+1.8−121.8
    K71116
    n2 (×1016  cm2/W)3.112.892.7
    σB (×1022  m2)9.219.632.4
    Table 1. Relevant Linear and Nonlinear Parameters of Sapphire Crystal at the Wavelengths of Interesta
    Atri Halder, Vytautas Jukna, Matias Koivurova, Audrius Dubietis, Jari Turunen. Coherence of bulk-generated supercontinuum[J]. Photonics Research, 2019, 7(11): 1345
    Download Citation