
Qiang Niu, Xiuhong Chen. Image Recognition Using Joint Projection Learning Algorithm Based on Latent Low-Rank Representation[J]. Laser & Optoelectronics Progress, 2019, 56(14): 141006
- Laser & Optoelectronics Progress
- Vol. 56, Issue 14, 141006 (2019)
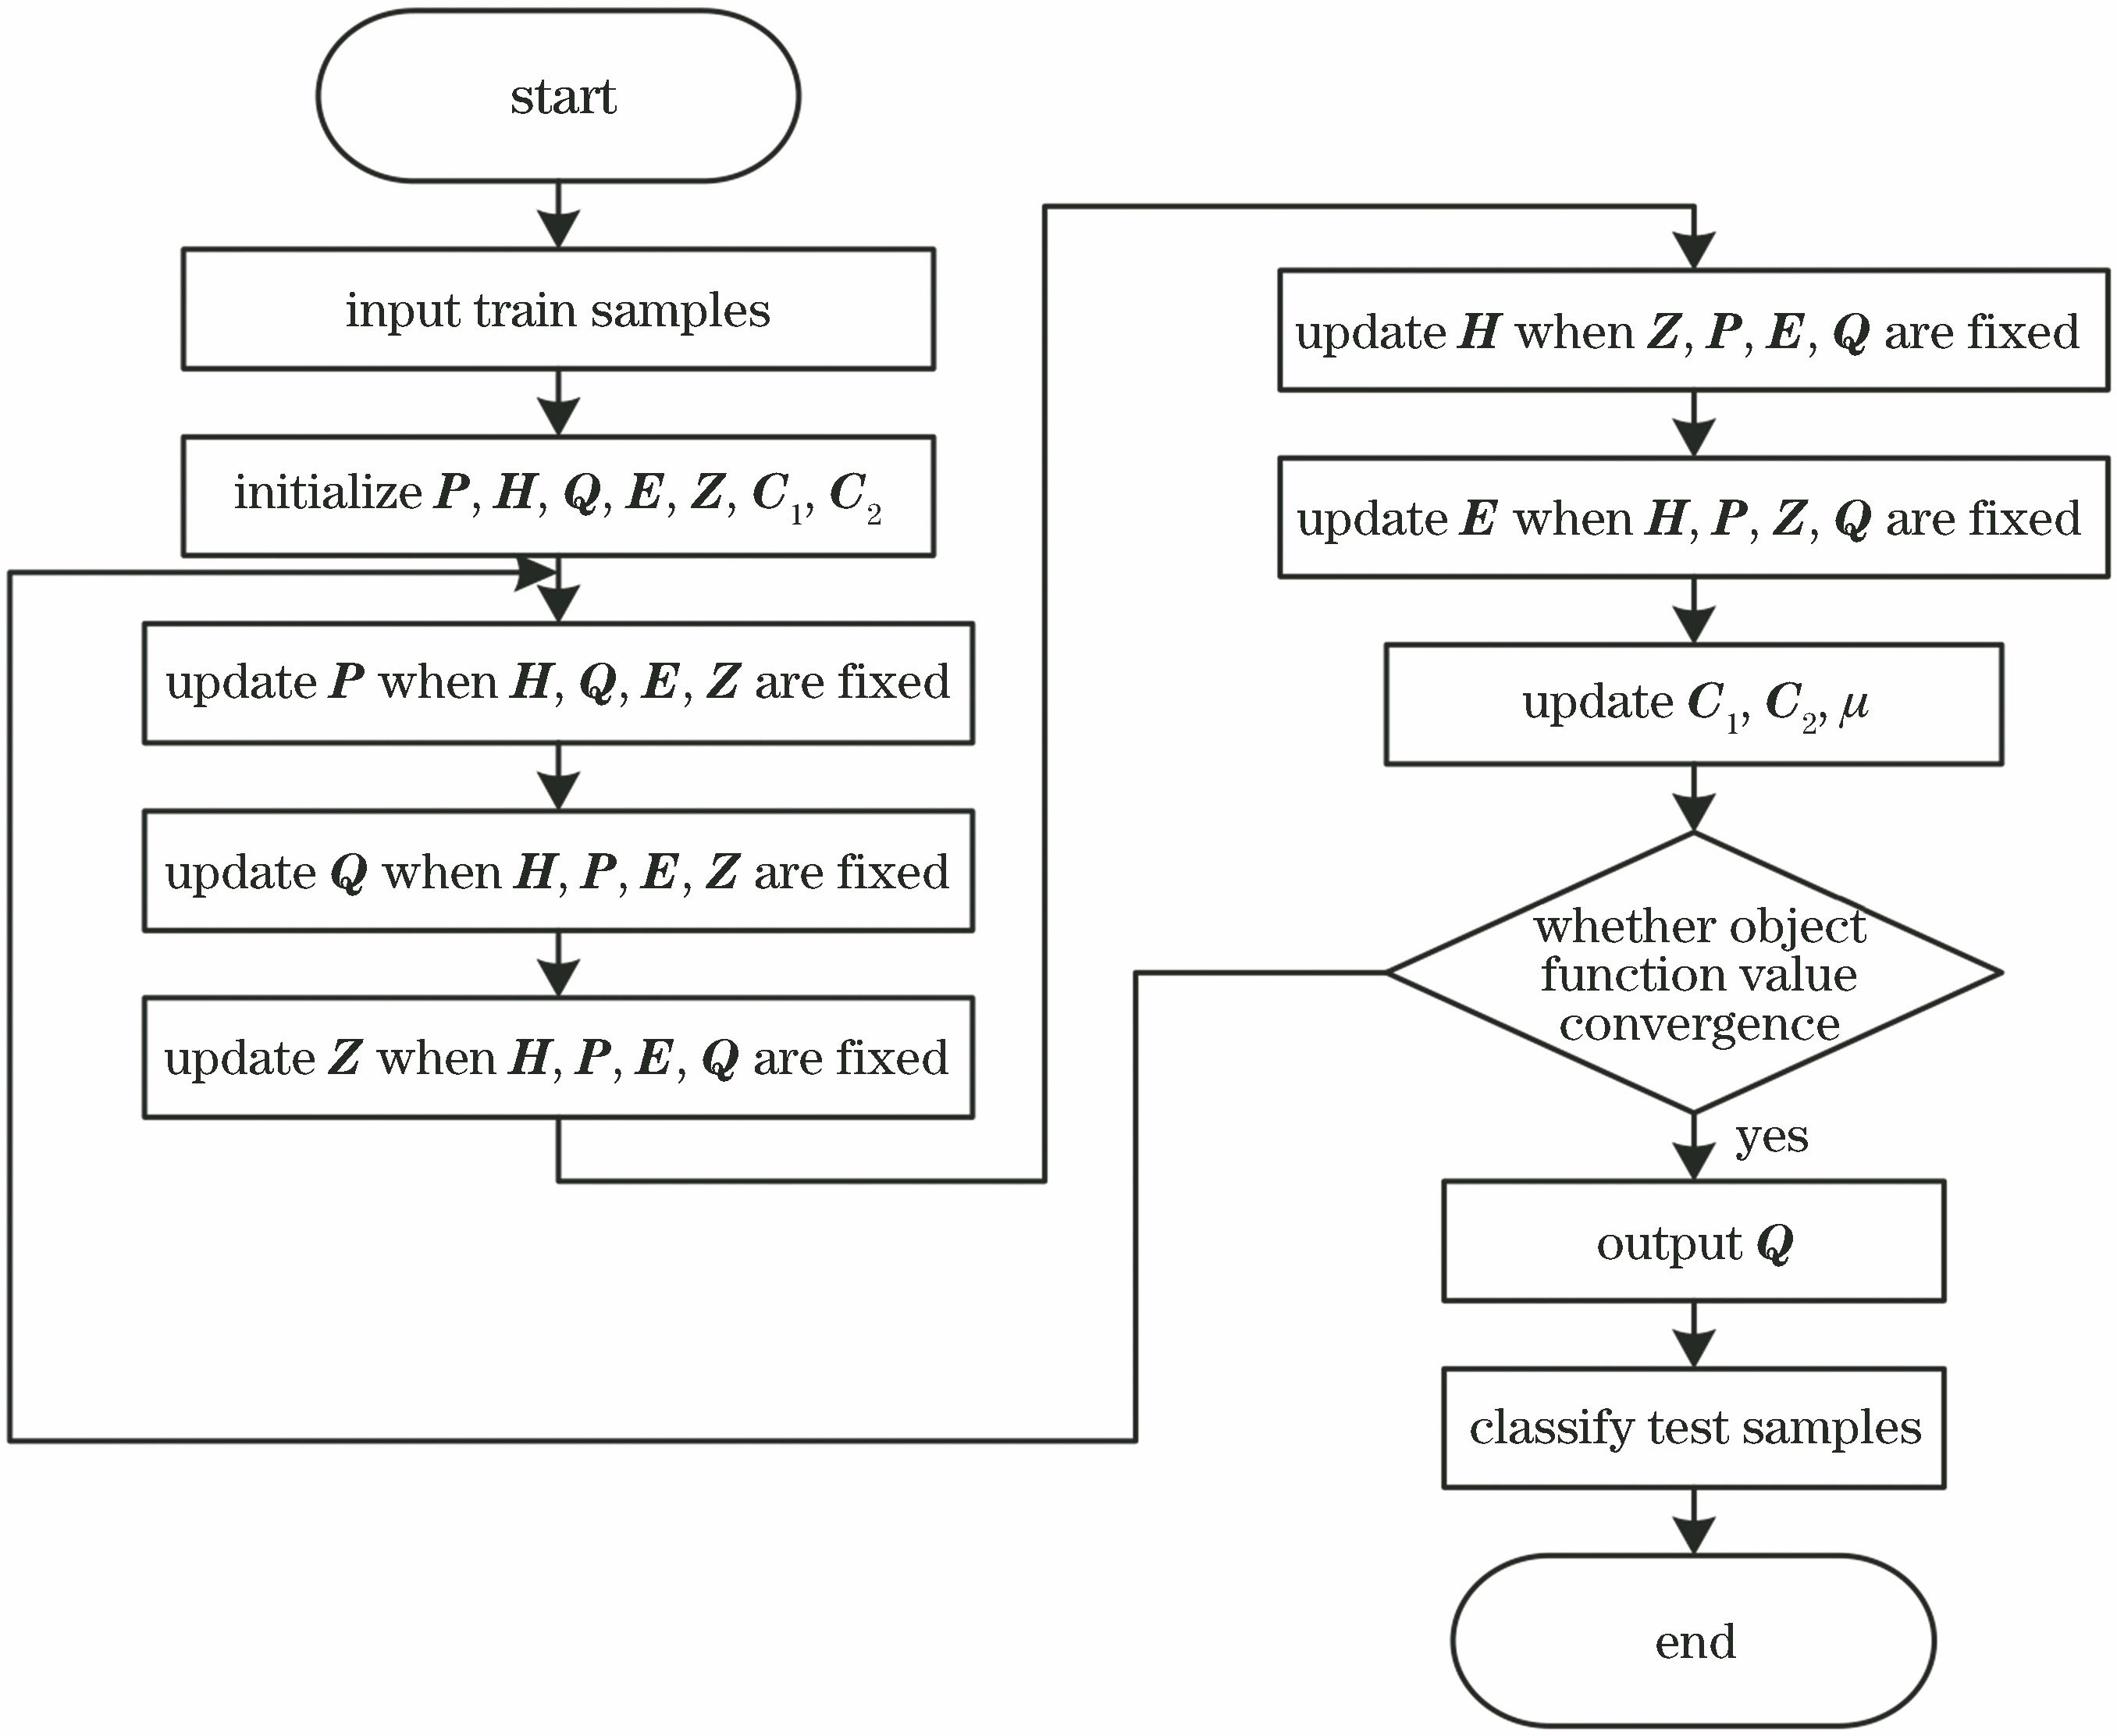
Fig. 1. Flow chart of algorithm
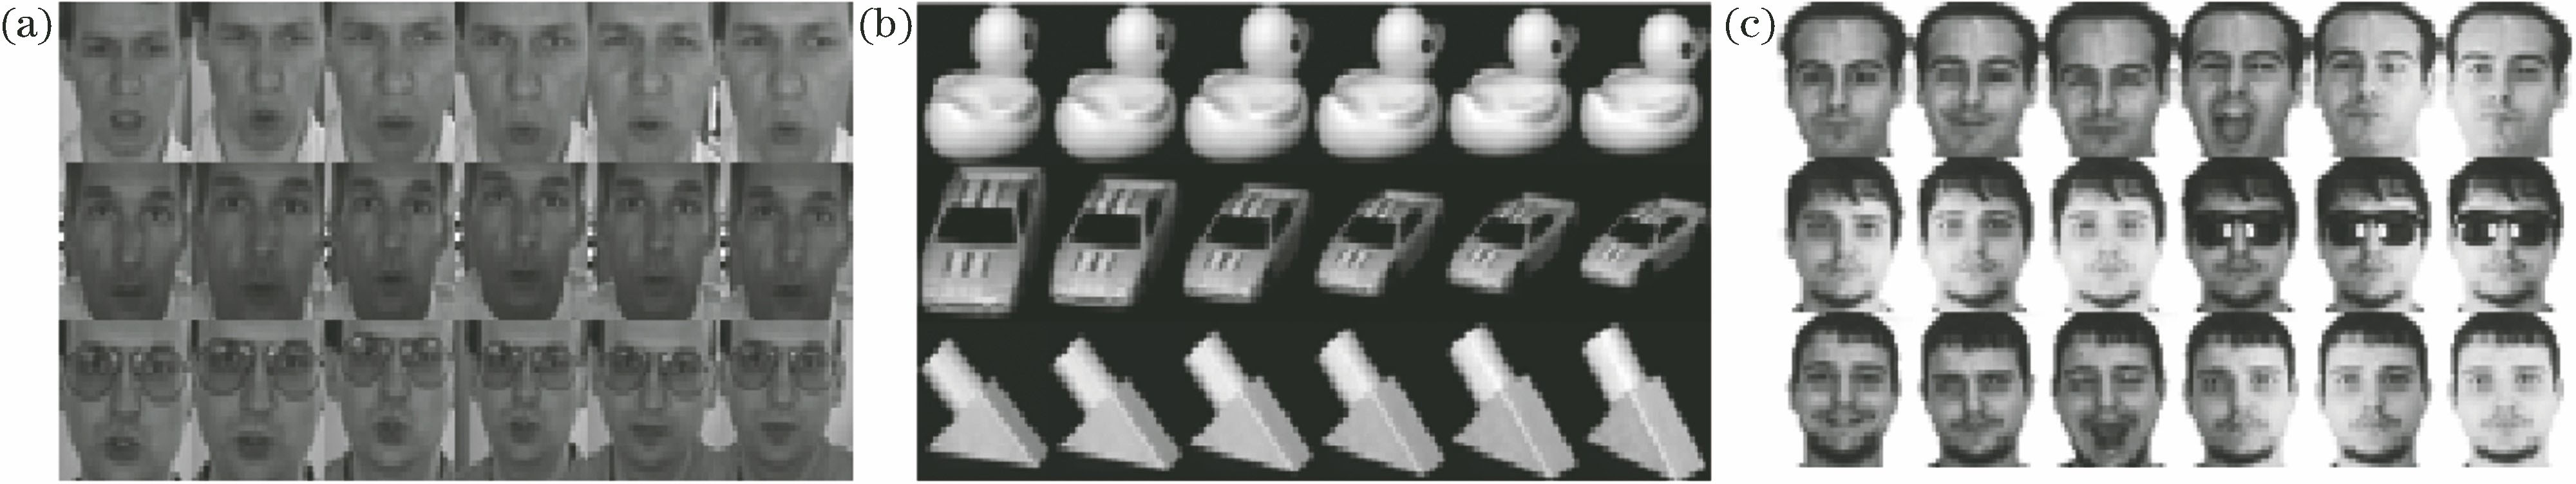
Fig. 2. Sample images of datasets. (a) BioID face database; (b) COIL20 dataset; (c) AR face database
Fig. 3. Iteration number versus value of objective function. (a) BioID face database; (b) COIL20 dataset; (c) AR face database
Fig. 4. Average recognition rate as a function of regularization parameters. (a) BioID face database; (b) AR face database
Fig. 5. Comparison of reconstructed images based on the BioID face database. (a) Images from BioID face database; (b) reconstructed images by LatLRR-JPL algorithm
Fig. 6. Comparison of reconstructed images based on the AR face database. (a) Images from AR face database; (b) reconstructed images by LatLRR-JPL algorithm
Fig. 7. Average recognition rate as a function of the number of feature dimensions. (a) BioID face database; (b) COIL20 dataset; (c) AR face database
|
Table 1. Average recognition rates and standard deviations of different algorithms on BioID face database%
|
Table 2. Average recognition rates and standard deviations of different algorithms on COIL20 dataset%
|
Table 3. Average recognition rates and standard deviations of different algorithms on AR face database%
|
Table 4. Running time of different algorithms on BioID face database and COIL20 datasets

Set citation alerts for the article
Please enter your email address
© Copyright 2018-2021 | Chinese Laser Press. All Rights Reserved 沪ICP备15018463号-20