• Photonics Research
  • Vol. 7, Issue 5, 518 (2019)
Jiangpeng Dong1, Kevin-P. Gradwohl2, Yadong Xu1、*, Tao Wang1, Binbin Zhang1, Bao Xiao1, Christian Teichert2, and Wanqi Jie1
Author Affiliations
  • 1State Key Laboratory of Solidification Processing, Ministry of Industry and Information Technology (MIIT) Key Laboratory of Radiation Detection Materials and Devices, School of Materials and Engineering, Northwestern Polytechnical University, Xi’an 710072, China
  • 2Institute of Physics, Montanuniversitaet Leoben, Leoben 8700, Austria
  • show less
    DOI: 10.1364/PRJ.7.000518 Cite this Article Set citation alerts
    Jiangpeng Dong, Kevin-P. Gradwohl, Yadong Xu, Tao Wang, Binbin Zhang, Bao Xiao, Christian Teichert, Wanqi Jie. Terahertz emission from layered GaTe crystal due to surface lattice reorganization and in-plane noncubic mobility anisotropy[J]. Photonics Research, 2019, 7(5): 518 Copy Citation Text show less
    Characterization of the GaTe crystal by (a) an XRD spectrum; (b) a Raman spectrum with a laser wavelength of 785 nm; (c) optical absorption spectra, with the excitonic absorption observed around 1.62 eV. Inset in (c) shows square root of the absorption as a function of energy, where the linear extrapolation reveals an optical bandgap of 0.76 eV, associated with an indirect bandgap; (d) PL spectrum of GaTe at 10 K under 488 nm laser excitation.
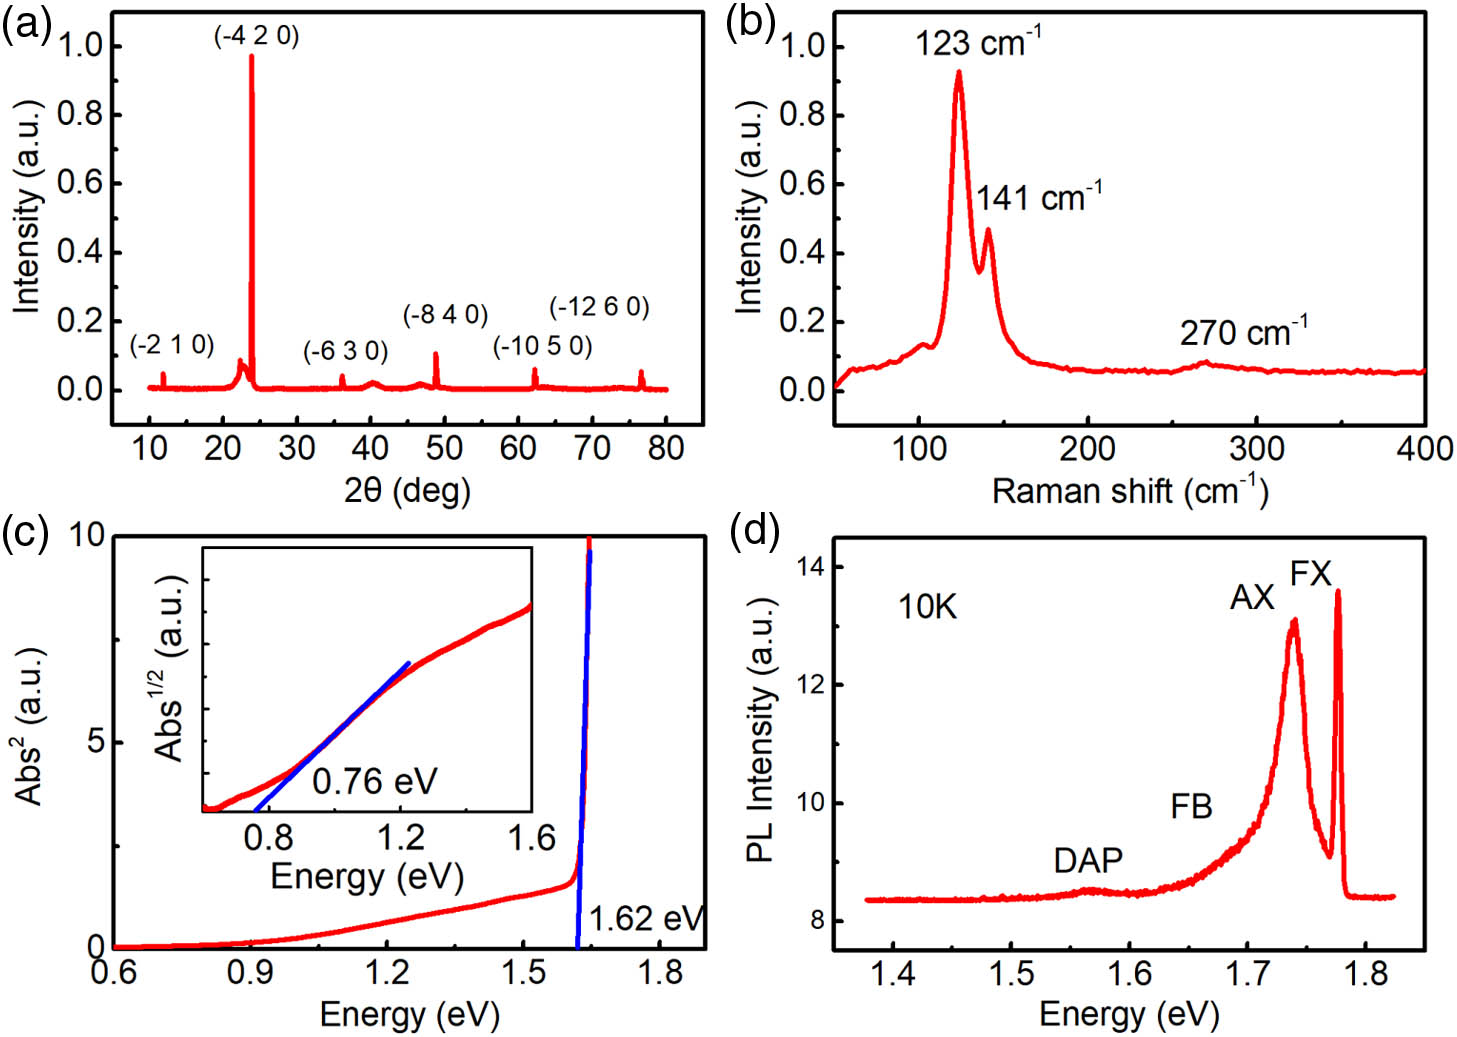
    Fig. 1. Characterization of the GaTe crystal by (a) an XRD spectrum; (b) a Raman spectrum with a laser wavelength of 785 nm; (c) optical absorption spectra, with the excitonic absorption observed around 1.62 eV. Inset in (c) shows square root of the absorption as a function of energy, where the linear extrapolation reveals an optical bandgap of 0.76 eV, associated with an indirect bandgap; (d) PL spectrum of GaTe at 10 K under 488 nm laser excitation.
    Experimental setup of the THz emission spectroscopy system used. (a) Schematic illustration. GTP, Glan–Taylor prism; HWP, half-wave plate; WGP, wire-grid polarizer. (b) Sample in transmission configuration. XYZ represents the Cartesian laboratory CS.
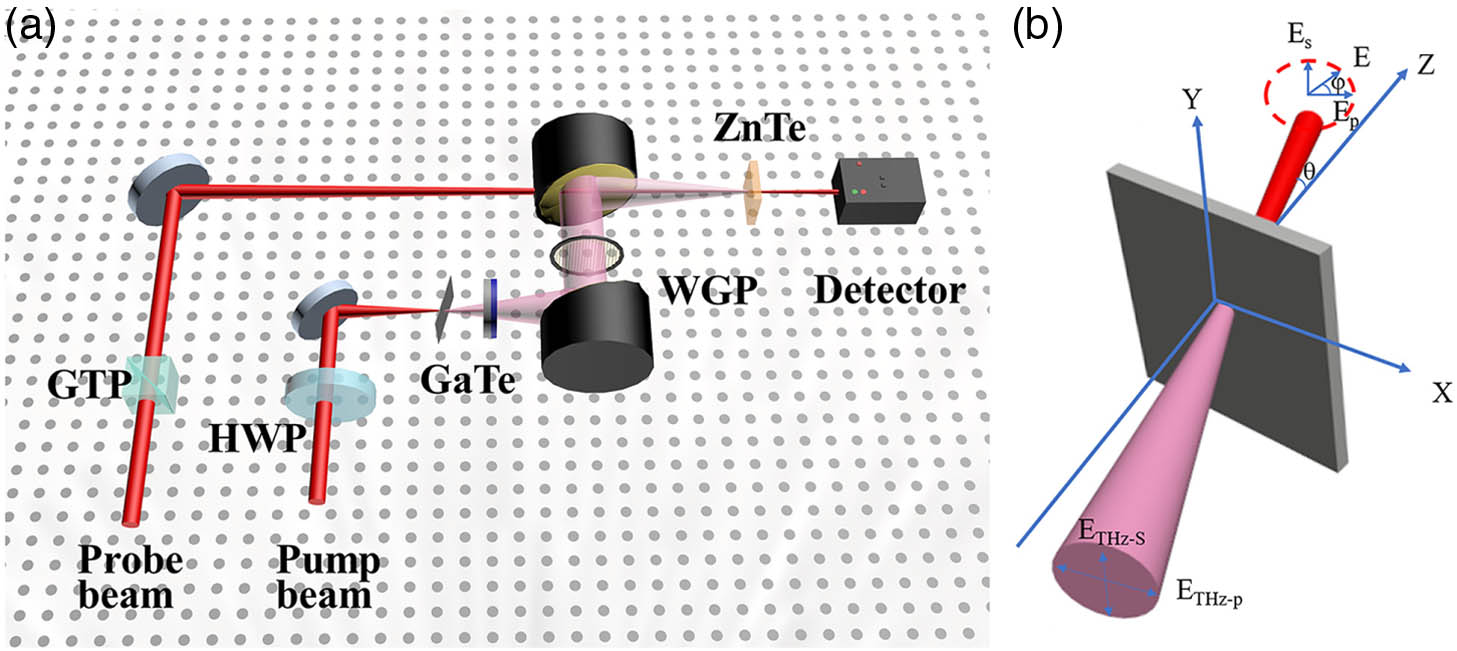
    Fig. 2. Experimental setup of the THz emission spectroscopy system used. (a) Schematic illustration. GTP, Glan–Taylor prism; HWP, half-wave plate; WGP, wire-grid polarizer. (b) Sample in transmission configuration. XYZ represents the Cartesian laboratory CS.
    Typical THz waveform in (a) time domain and (b) frequency domain generated from layered GaTe.
    Fig. 3. Typical THz waveform in (a) time domain and (b) frequency domain generated from layered GaTe.
    X component of the generated THz waveforms from GaTe under p-polarized (Pin) and s-polarized (Sin) excitation with (a) 0° and (b) 40° incident angle; (c) X component of generated THz waveforms from GaTe under 40°, −40°, 0° incidences; (d) peak-to-valley values of THz pulses from GaTe as a function of incident angle.
    Fig. 4. X component of the generated THz waveforms from GaTe under p-polarized (Pin) and s-polarized (Sin) excitation with (a) 0° and (b) 40° incident angle; (c) X component of generated THz waveforms from GaTe under 40°, 40°, 0° incidences; (d) peak-to-valley values of THz pulses from GaTe as a function of incident angle.
    THz radiation peak-valley amplitude as a function of (a) azimuthal angle and (b) pump polarization angle under normal incidence. The experimental data and the fitting according to the OR and PS model are depicted by black squares and solid lines, respectively.
    Fig. 5. THz radiation peak-valley amplitude as a function of (a) azimuthal angle and (b) pump polarization angle under normal incidence. The experimental data and the fitting according to the OR and PS model are depicted by black squares and solid lines, respectively.
    THz peak-valley amplitude as a function of (a) azimuthal angle and (b) pump polarization angle under 40° incident angle. The experimental data and the fitting according to the OR and PS model are depicted by black squares and solid lines, respectively.
    Fig. 6. THz peak-valley amplitude as a function of (a) azimuthal angle and (b) pump polarization angle under 40° incident angle. The experimental data and the fitting according to the OR and PS model are depicted by black squares and solid lines, respectively.
    Pump fluence dependence of THz peak-to-valley amplitude generated from GaTe at (a) 0° and (b) 40° incident angle.
    Fig. 7. Pump fluence dependence of THz peak-to-valley amplitude generated from GaTe at (a) 0° and (b) 40° incident angle.
    Samplet mmρ12ρ34Averageρ23ρ14Average
    (Ω·cm)
    10.21134108121178512591522
    20.53103105104143014481439
    30.17187187187146514491457
    Table 1. Resistivity Anisotropy of Bulk GaTe Surface
    Jiangpeng Dong, Kevin-P. Gradwohl, Yadong Xu, Tao Wang, Binbin Zhang, Bao Xiao, Christian Teichert, Wanqi Jie. Terahertz emission from layered GaTe crystal due to surface lattice reorganization and in-plane noncubic mobility anisotropy[J]. Photonics Research, 2019, 7(5): 518
    Download Citation