
Xixi Zhang, Xiaogang Ji, Haitao Hu, Yuhao Luan, Jian'an Zhang. Point Cloud Segmentation Method for Complex Micro-Surface Based on Feature Line Fitting[J]. Laser & Optoelectronics Progress, 2020, 57(6): 061502
- Laser & Optoelectronics Progress
- Vol. 57, Issue 6, 061502 (2020)
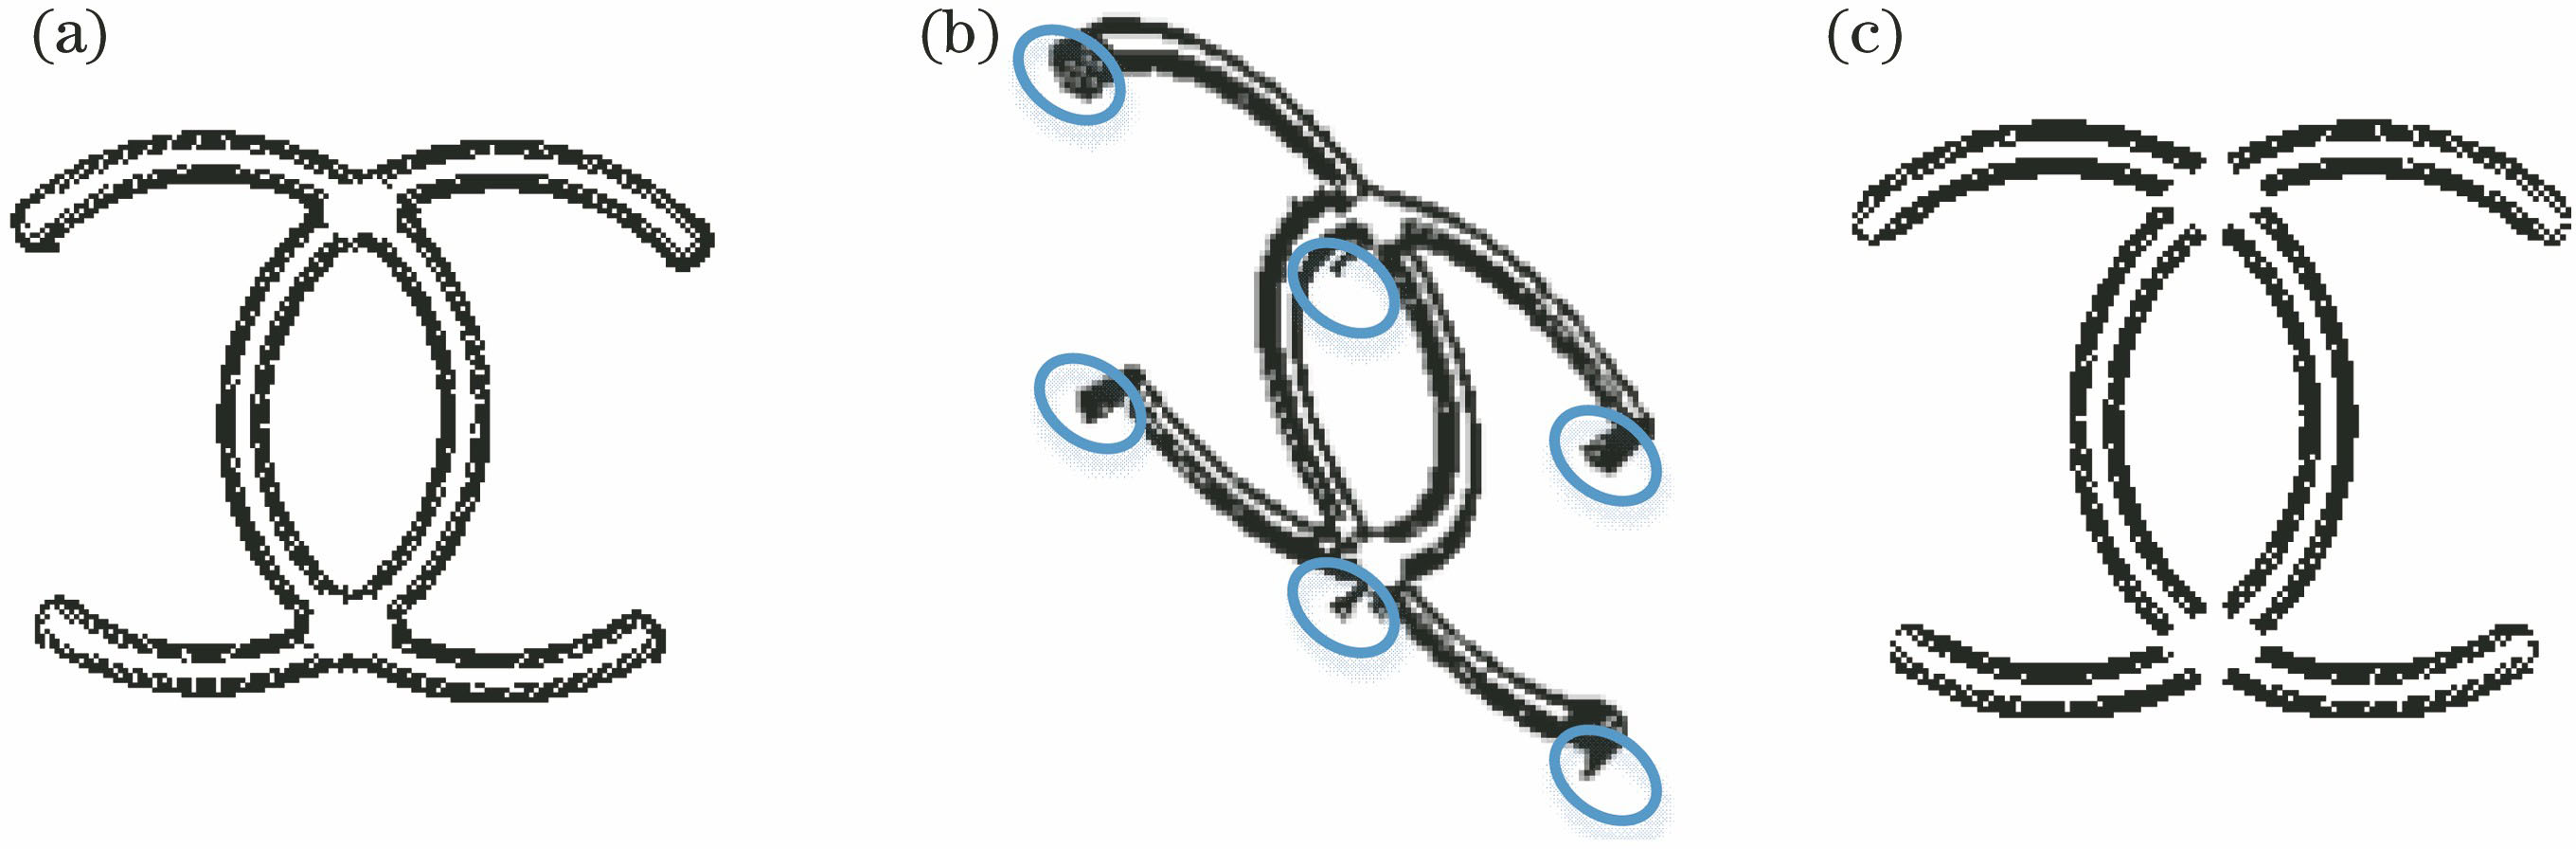
Fig. 1. Feature points of part with complex surface. (a) Front view of feature points; (b) isometric side view of feature points; (c) processed feature points
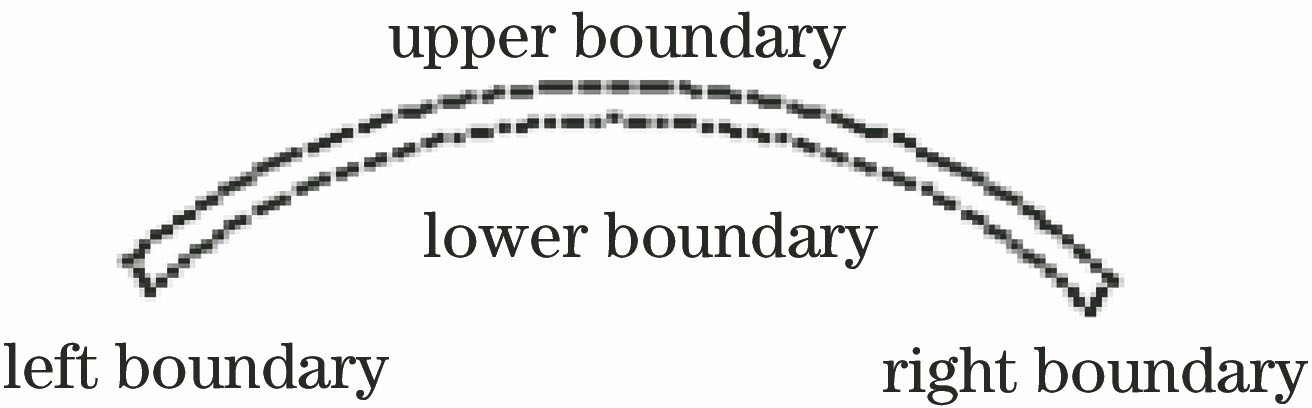
Fig. 2. Element boundary points
Fig. 3. Process of feature point reduction. (a) Elements after separation; (b) boundary points of elements; (c) lower boundary points of elements
Fig. 4. Model of banded feature points
Fig. 5. Schematic of piecewise least square
Fig. 6. Separation process of lower boundary points. (a) Lower boundary points containing partial high points; (b) complete lower boundary points; (c) lower boundary points after filtering
Fig. 7. Trend matching of elements. (a) Eight cases of element trend matching; (b) diagram of element recognition
Fig. 8. Segmentation process for point cloud data. (a) Interior points of surface identified by regional growth; (b) interior and exterior points of enlarged local surface; (c) segmented surface points by combining two methods
Fig. 9. Discrimination process for points near boundary. (a) Magnified local triangular mesh; (b) vector discrimination principle diagram; (c) diagram of distinguishing inner and outer points
Fig. 10. Reconstructed surface and comparison of surface accuracy. (a) Reconstructed surface; (b) comparison of surface accuracy
Fig. 11. Lower boundary extraction process of belt buckle. (a) Feature points of belt buckle part; (b) boundary points of feature points; (c) lower boundary points of feature points
Fig. 12. Comparison of segmentation effect of point cloud data. (a) Point cloud segmented by algorithm in Ref. [4]; (b) point cloud segmented by Geomagic Designx; (c) point cloud segmented by algorithm in this paper
Fig. 13. Reconstructed surface and comparison of surface accuracy. (a) Reconstructed surface; (b) comparison of surface accuracy
|
Table 1. Experimental data for judging concavity and convexity
|
Table 2. Comparison of number of surfaces segmented by different methods

Set citation alerts for the article
Please enter your email address
© Copyright 2018-2021 | Chinese Laser Press. All Rights Reserved 沪ICP备15018463号-20