• Journal of Geographical Sciences
  • Vol. 30, Issue 1, 18 (2020)
Shiwen FU1、1、1、1, Suping NIE1、1, Yong LUO1、1、1、1、*, and Xin CHEN1、1
Author Affiliations
  • 12Numerical Weather Prediction Center, China Meteorological Administration, Beijing 100081, China
  • 13National Climate Center, China Meteorological Administration, Beijing 100081, China
  • show less
    DOI: 10.1007/s11442-020-1712-0 Cite this Article
    Shiwen FU, Suping NIE, Yong LUO, Xin CHEN. Implications of diurnal variations in land surface temperature to data assimilation using MODIS LST data[J]. Journal of Geographical Sciences, 2020, 30(1): 18 Copy Citation Text show less
    Flow chart of the LST assimilation scheme
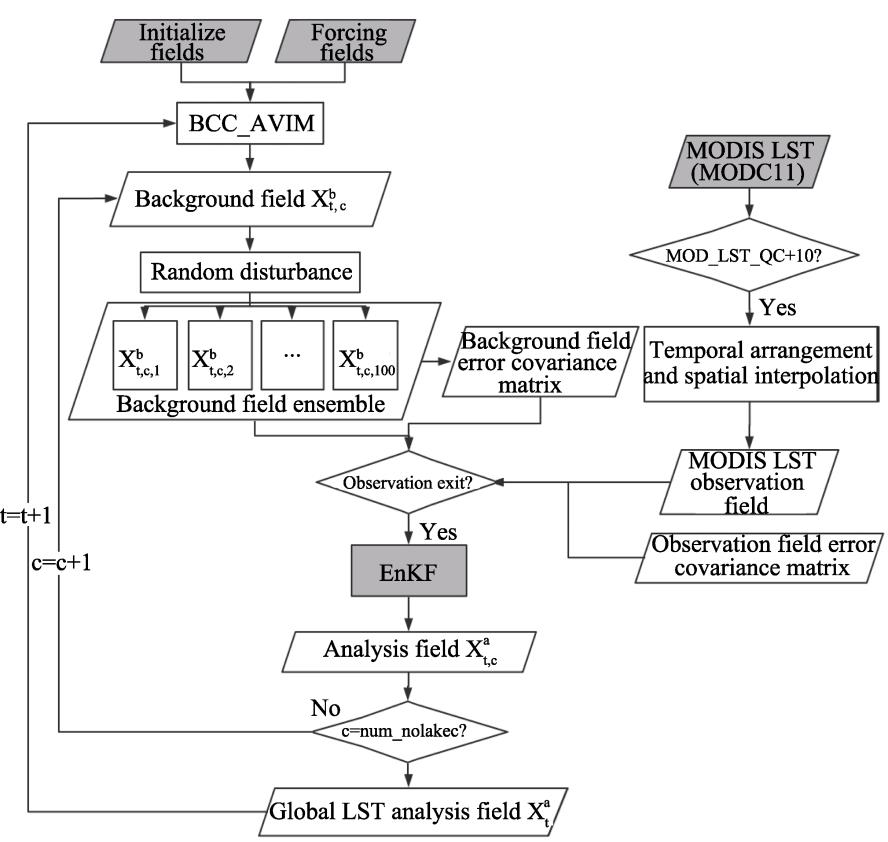
    Fig. 1. Flow chart of the LST assimilation scheme
    LST (a, b) and observation time (c, d) during the daytime (a, c) and nighttime (b, d) using the MOD11C1 global LST product on 1st June, 2014
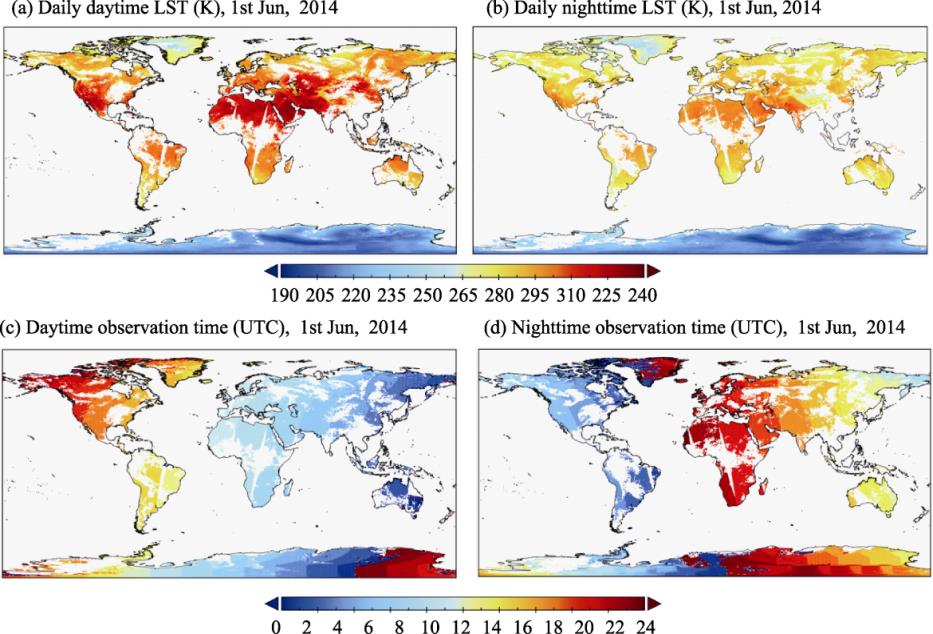
    Fig. 2. LST (a, b) and observation time (c, d) during the daytime (a, c) and nighttime (b, d) using the MOD11C1 global LST product on 1st June, 2014
    LST observation distributions after processing for 3-hour (a), 6-hour (b), 12-hour (c), and 24-hour (d) time intervals according to the observation time
    Fig. 3. LST observation distributions after processing for 3-hour (a), 6-hour (b), 12-hour (c), and 24-hour (d) time intervals according to the observation time
    The global mean LST sequence, with time intervals of 3 hours, 6 hours, 12 hours, and 24 hours respectively
    Fig. 4. The global mean LST sequence, with time intervals of 3 hours, 6 hours, 12 hours, and 24 hours respectively
    From 2014 to 2015, the spatial distributions of the bias (K) of the LST simulation results for each experiment compared with GLDAS LSTs
    Fig. 5. From 2014 to 2015, the spatial distributions of the bias (K) of the LST simulation results for each experiment compared with GLDAS LSTs
    The number of grid points distributed for each bias interval, where the bias values are calculated via the simulation results for each experiment minus the GLDAS results
    Fig. 6. The number of grid points distributed for each bias interval, where the bias values are calculated via the simulation results for each experiment minus the GLDAS results
    Comparison of monthly average absolute bias values in the LST simulation results for each experiment with the GLDAS LSTs
    Fig. 7. Comparison of monthly average absolute bias values in the LST simulation results for each experiment with the GLDAS LSTs
    The spatial distributions of the RMSE (K) for the LST simulation results in each experiment compared with the GLDAS LST results
    Fig. 8. The spatial distributions of the RMSE (K) for the LST simulation results in each experiment compared with the GLDAS LST results
    Comparison of monthly average RMSEs in the LST simulation results of the experiments with those of the GLDAS
    Fig. 9. Comparison of monthly average RMSEs in the LST simulation results of the experiments with those of the GLDAS
    The spatial distributions of the correlation coefficients between the LST simulation results via the experiments and the GLDAS LSTs
    Fig. 10. The spatial distributions of the correlation coefficients between the LST simulation results via the experiments and the GLDAS LSTs
    Comparison of the correlation coefficients between the surface temperature simulation results of the experiments and the GLDAS LSTs
    Fig. 11. Comparison of the correlation coefficients between the surface temperature simulation results of the experiments and the GLDAS LSTs
    No.EXP nameEXP timeAssimilationTime stepTime interval for theobservation data
    1CTL2014.01-2015.12No30 minutes-
    2ASSI12014.01-2015.12Yes30 minutes3 hours
    3ASSI22014.01-2015.12Yes30 minutes6 hours
    4ASSI32014.01-2015.12Yes30 minutes12 hours
    5ASSI42014.01-2015.12Yes30 minutes24 hours
    Table 1.

    LST assimilation experimental design

    Experiment nameCTLASSI1ASSI2ASSI3ASSI4
    Absolute bias2.570 K2.252 K2.172 K2.245 K2.262 K
    RMSE4.239 K3.681 K3.648 K3.992 K4.423 K
    Correlation coefficient0.5250.6190.6150.5710.525
    Table 2.

    The comparison between the LST simulation results and the GLDAS LSTs using global mean absolute bias, RMSE and correlation coefficient

    CTLASSI1ASSI2ASSI3ASSI4
    January, 20142.882.442.362.352.41
    April, 20142.42.122.011.931.93
    July, 20142.242.081.9721.94
    October, 20142.462.082.022.282.37
    January, 20152.852.352.32.372.41
    April, 20152.492.222.092.041.99
    July, 20152.22.212.112.182.11
    October, 20152.582.152.12.262.42
    Table 3.

    Comparison of monthly average absolute bias values on representative months

    CTLASSI1ASSI2ASSI3ASSI4
    January, 20145.024.434.414.675.00
    April, 20144.053.543.493.774.31
    July, 20143.693.173.133.443.91
    October, 20144.033.443.443.944.40
    January, 20155.024.394.384.674.97
    April, 20154.043.553.473.764.22
    July, 20153.613.253.213.543.99
    October, 20154.153.523.523.994.48
    Table 4.

    Comparison of monthly average RMSE values on representative months

    CTLASSI1ASSI2ASSI3ASSI4
    January, 20140.550.60.590.550.52
    April, 20140.560.640.640.590.53
    July, 20140.420.510.50.460.4
    October, 20140.570.680.680.620.58
    January, 20150.550.60.610.570.54
    April, 20150.590.650.660.620.57
    July, 20150.470.550.540.490.43
    October, 20150.550.670.660.620.57
    Table 5.

    Comparison of monthly average correlation coefficients values on representative months

    Shiwen FU, Suping NIE, Yong LUO, Xin CHEN. Implications of diurnal variations in land surface temperature to data assimilation using MODIS LST data[J]. Journal of Geographical Sciences, 2020, 30(1): 18
    Download Citation