
Miao Li, Tong Yao, Zuhua Yang, Jun Shi, Feng Wang, Guohong Yang, Minxi Wei, Ao Sun, Yang Li. Designing a toroidal crystal for monochromatic X-ray imaging of a laser-produced He-like plasma[J]. High Power Laser Science and Engineering, 2022, 10(6): 06000e37
- High Power Laser Science and Engineering
- Vol. 10, Issue 6, 06000e37 (2022)
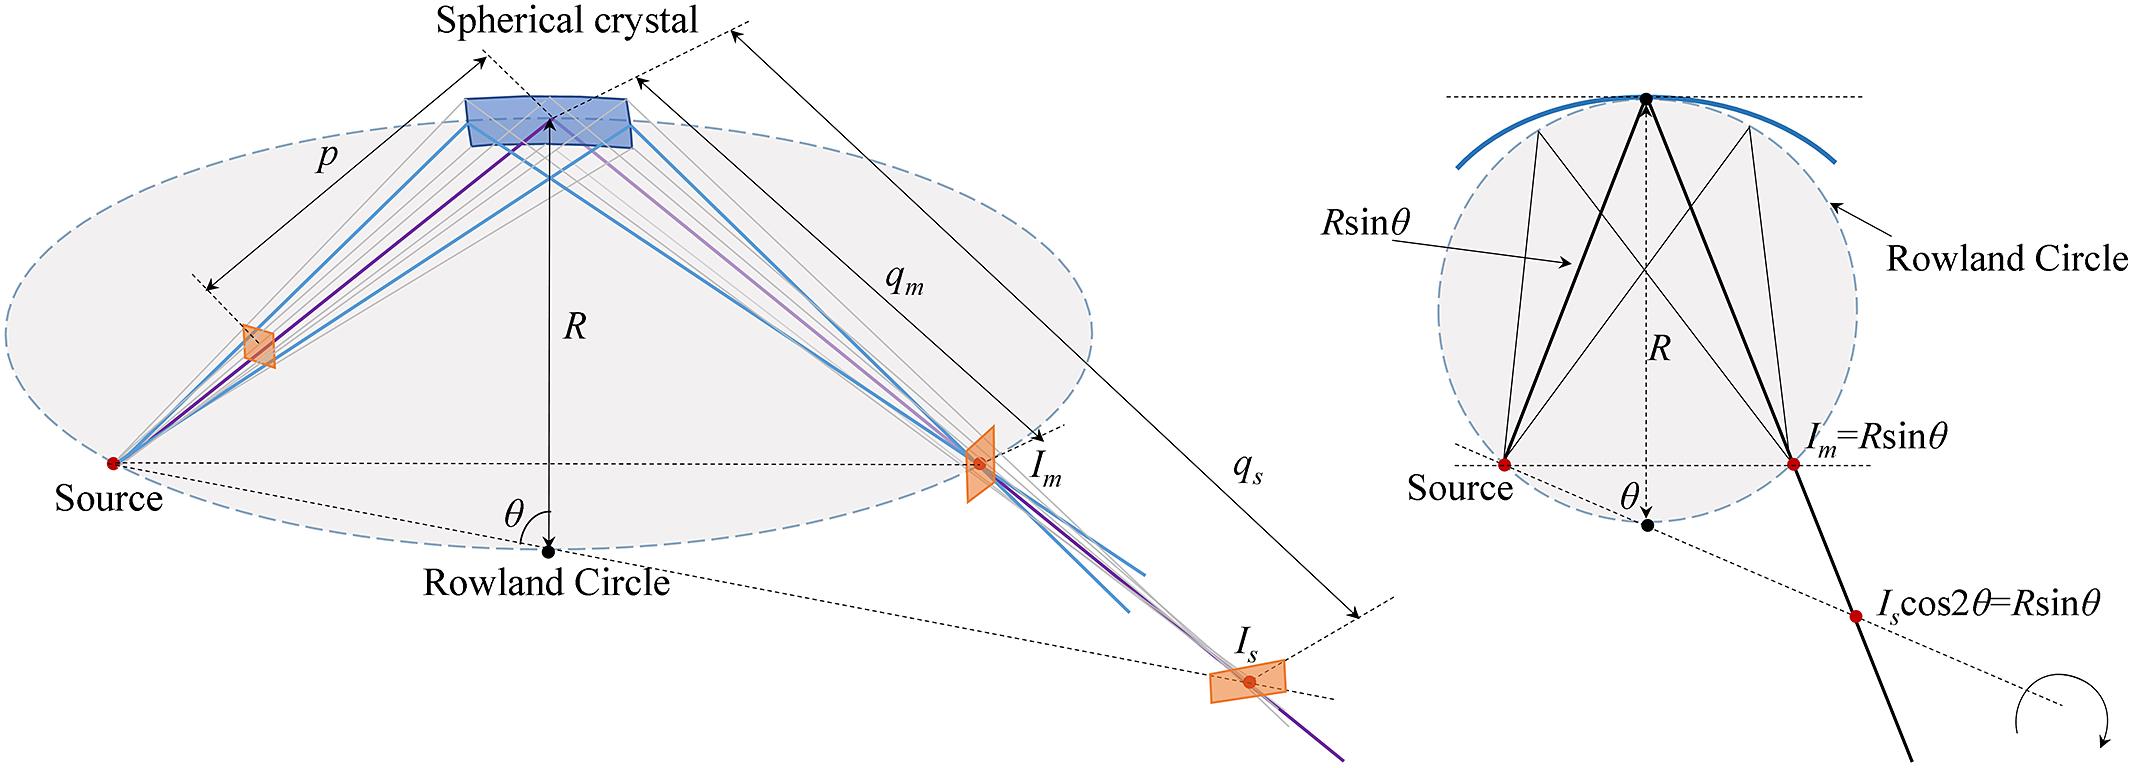
Fig. 1. Working principle of a spherical crystal-based imaging system. The X-rays emitted by the source are focused at point (I m) on the Rowland circle after being diffracted by the spherical crystal. However, in the sagittal plane, the crystal can focus the X-rays at the focal point (I s) of the plane. The effect of the spherical crystal on the X-rays is equivalent to that of a concave mirror in the sagittal plane.
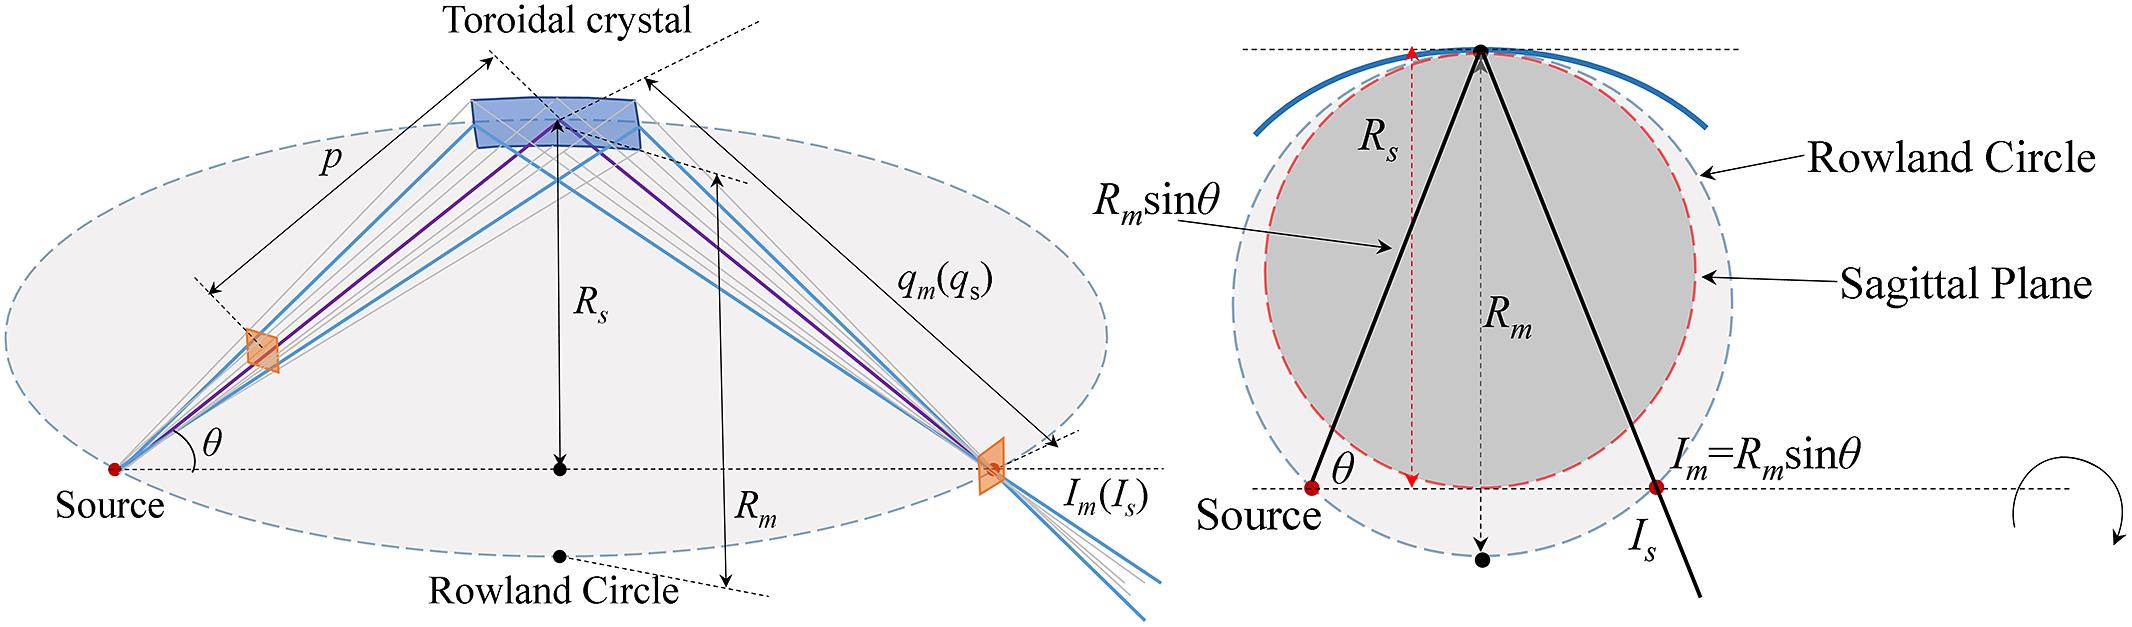
Fig. 2. Working principle of a toroidal crystal-based imaging system. In the case of a toroidal crystal, the rays from the sagittal and meridional planes are focused at the same focal point. The toroidal crystal can be used for imaging self-luminous objects without requiring a Bragg angle close to 90°.
Fig. 3. Simulated 3D diffracted beam trajectory of the designed toroidal crystal spectrometer.
Fig. 4. Calculated Darwin reflectivity curves based on the multi-lamellar method: (a) p-polarized X-rays; (b) s-polarized X-rays.
Fig. 5. Comparison of the simulation imaging results: (a) image produced by a spherical crystal; (b) image produced by a toroidal crystal.
Fig. 6. Comparison of simulation spectral imaging results: (a) image spectrum of the spherical crystal in the sagittal plane; (b) image spectrum of the toroidal crystal in the sagittal plane; (c) image spectrum of the spherical crystal in the meridional plane; (d) imaging spectrum of the toroidal crystal in the meridional plane.
Fig. 7. Focused image of the source: (a) focused image of the source produced by the spherical crystal; (b) focused image of the source produced by the toroidal crystal.
Fig. 8. Surface roughness distribution used in the simulation. The surface data can be combined with the designed crystal surface data. The roughness distribution has more serious variance in the y -direction (the optical axis direction).
Fig. 9. Imaging under different conditions of slope error RMS values: (a) imaging when the surface error RMS is 0 μm; (b) imaging when the surface error RMS is 1 μm; (c) imaging when the surface error RMS is 3 μm; (d) imaging when the surface error RMS is 5 μm; (e) imaging when the surface error RMS is 10 μm; (f) imaging when the surface error RMS is 15 μm.
Fig. 10. Image of the toroidal crystal used in the experiment (crystal size: 45 mm × 20 mm, supported on a BK7 glass).
Fig. 11. Backlight imaging results of the quartz toroidal crystal, raw image (zoom in) and intensity map.
Fig. 12. Spatial intensity distribution of the imaging grid.
|
Table 1. Imaging parameters of a backlight imaging system.

Set citation alerts for the article
Please enter your email address
© Copyright 2018-2021 | Chinese Laser Press. All Rights Reserved 沪ICP备15018463号-20