
Huitong Yang, Liang Lei, Yongchun Lin. Binocular Depth Estimation Algorithm Based on Multi-Scale Attention Feature Fusion[J]. Laser & Optoelectronics Progress, 2022, 59(18): 1815005
- Laser & Optoelectronics Progress
- Vol. 59, Issue 18, 1815005 (2022)
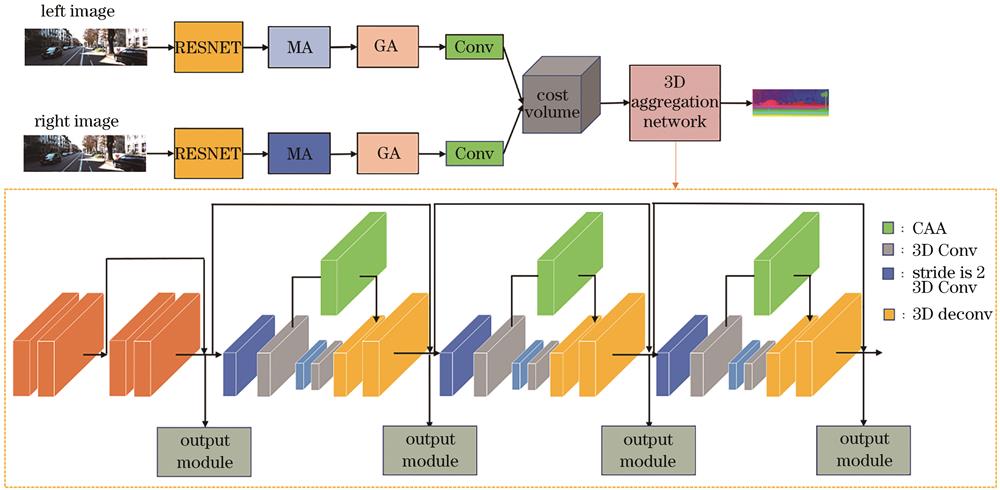
Fig. 1. Overall structure of multi-scale attention fusion network
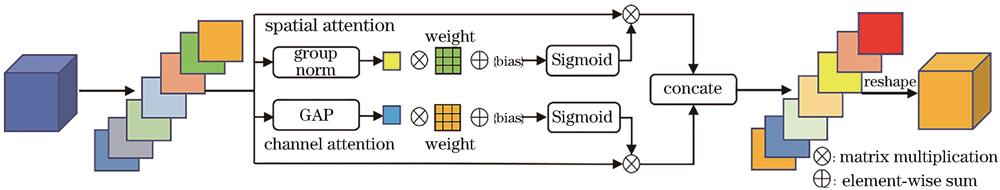
Fig. 2. Group-related attention fusion module
Fig. 3. Multi-scale convolution global attention module
Fig. 4. 3D channel attention aggregation module
Fig. 5. Parallax maps obtained by different algorithms on SceneFlow dataset
Fig. 6. Visualization results of ablation experiment on KITTI2015 test set
Fig. 7. Qualitative evaluation results of different networks on KITTI2015 dataset
Fig. 8. Qualitative evaluation results of different networks on KITTI2012 dataset
Fig. 9. Qualitative evaluation results of different networks on Middlebury-v3 dataset
| |||||||||||||||||||||||||||||||||||
Table 1. Ablation study results on SceneFlow dataset
|
Table 2. Comparison of EPE between MGNet and other methods
|
Table 3. Benchmark results of designed module on KITTI2015 dataset
| ||||||||||||||||||||||||||||||||||||||||||||||||||||||||||||||||||||||||||||
Table 4. Comparison of different networks on KITTI2015 dataset
| |||||||||||||||||||||||||||||||||||||||||||||||||||||||||||||||||||||||||||||||||||||||||||||||||||||||||||
Table 5. Comparison of different networks on KITTI2012 dataset

Set citation alerts for the article
Please enter your email address
© Copyright 2018-2021 | Chinese Laser Press. All Rights Reserved 沪ICP备15018463号-20