
Jialin Cheng, Jiliang Qin, Shaocong Liang, Jiatong Li, Zhihui Yan, Xiaojun Jia, Kunchi Peng, "Mutually testing source-device-independent quantum random number generator," Photonics Res. 10, 646 (2022)
- Photonics Research
- Vol. 10, Issue 3, 646 (2022)
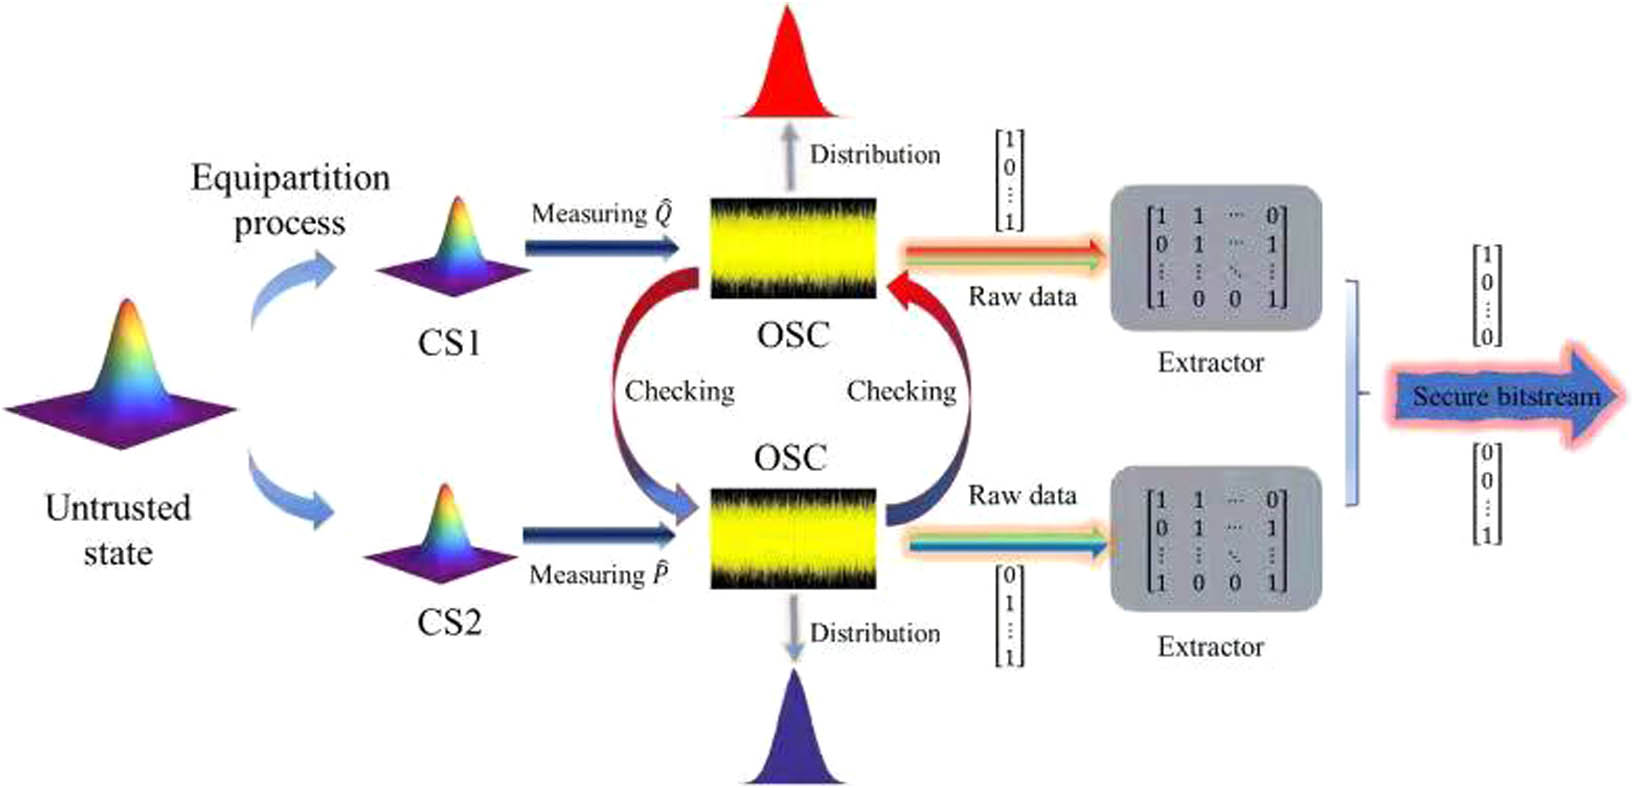
Fig. 1. Flow diagram of the experimental structure. An untrusted coherent state (CS) is divided into two identical and probably impure parts, CS1 for measuring quadrature Q ^ P ^
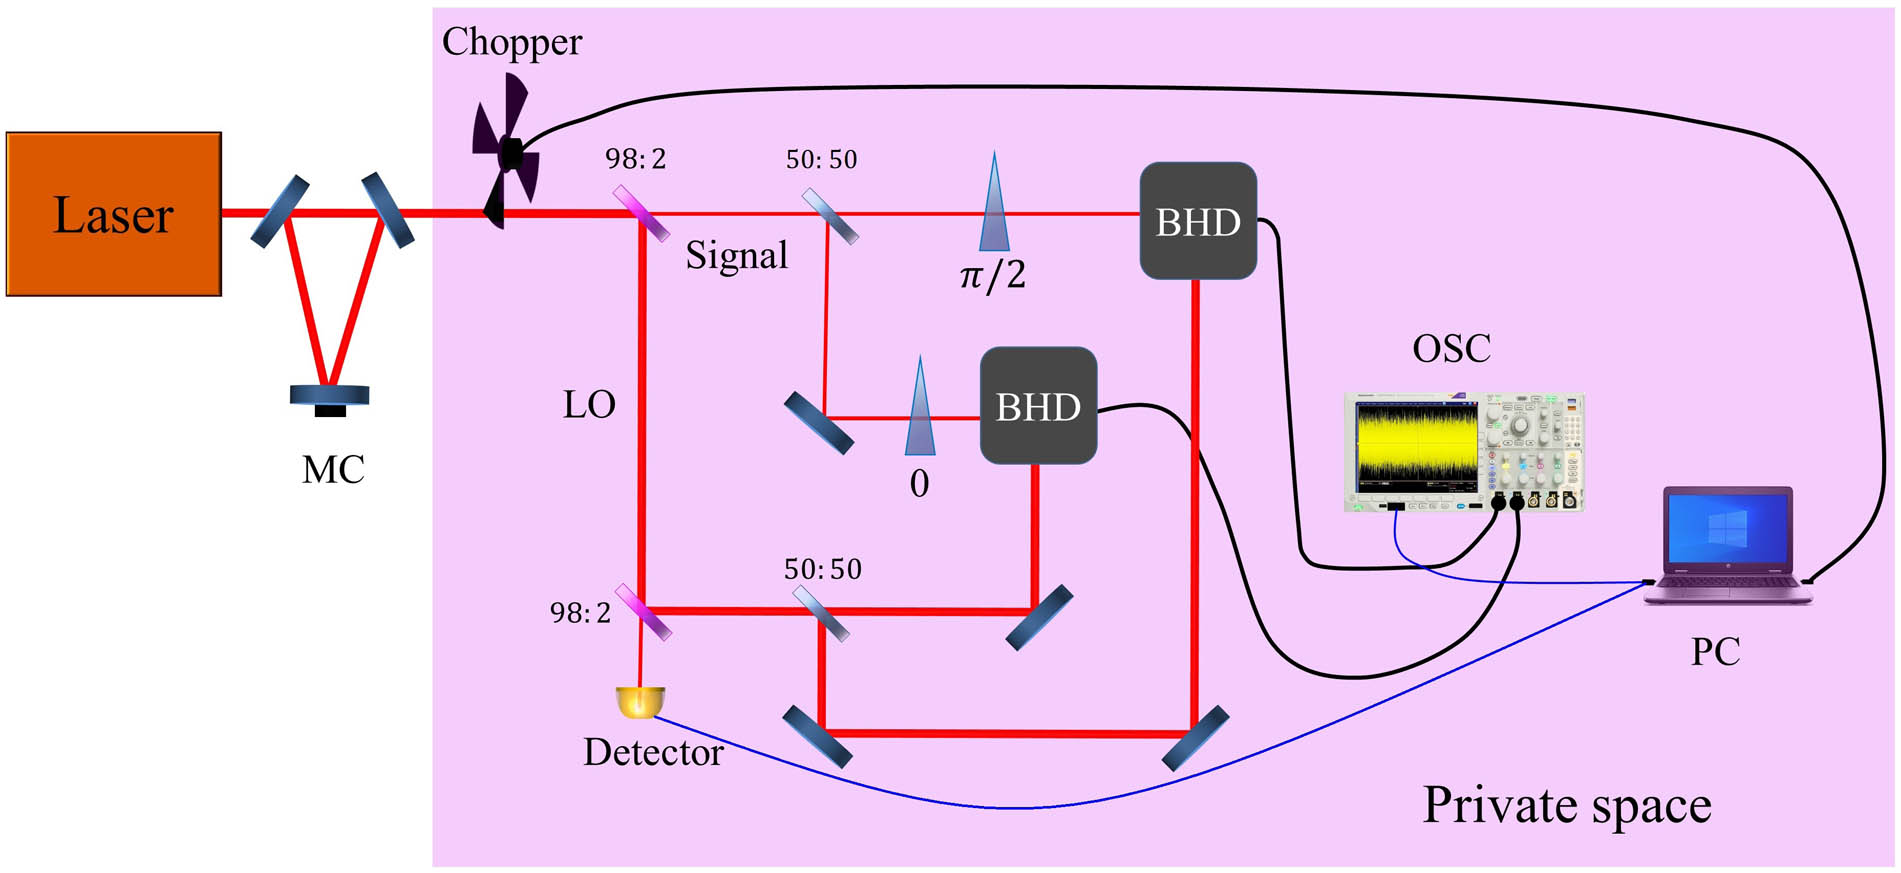
Fig. 2. Experimental schematic configuration for mutually testing SDI QRNG. The pink area is a private space that no eavesdropper has access to. The black and blue curves represent the electric and data cables, respectively. The coherent state is generated via a laser and MC. The laser beam is divided into the signal beam and LO via a 98:2 BS. Both the signal beam and the LO are split in half via two 50:50 BSs. Two BHDs are used to measure the quadrature P ^ Q ^ π / 2 Nd : YVO 4
Fig. 3. Red, blue, and black curves show the autocorrelations calculated from the raw bits, the downsampled bits, and the extracted bits, respectively. The three data streams have the same length of 5 × 10 7
Fig. 4. Comparison of the data acquisitions and appropriate time sequences of mutually testing and randomly toggling manners. The red and blue points represent the measured data of quadratures P ^ Q ^ P ^ Q ^ Q ^ P ^ Q ^
Fig. 5. Schematic of the balanced homodyne detection. The difference current is converted into an amplified voltage signal by a transimpedance amplifier.
|
Table 1. Results of NIST Test Suite on the Extracted Random Bitsa


Set citation alerts for the article
Please enter your email address

© Copyright 2018-2021 | Chinese Laser Press. All Rights Reserved 沪ICP备15018463号-20