• Spectroscopy and Spectral Analysis
  • Vol. 42, Issue 4, 1323 (2022)
Kai-yi ZHENG1、*, Wen ZHANG1、1;, Fu-yuan DING1、1;, Chen-guang ZHOU1、1;, Ji-yong SHI1、1;, Marunaka Yoshinori2、2;, and Xiao-bo ZOU1、1; *;
Author Affiliations
  • 11. School of Food and Biological Engineering, Jiangsu University, Zhenjiang 212013, China
  • 22. Department of Molecular Cell Physiology, Kyoto Prefectural University of Medicine, Kyoto 602-8566, Japan
  • show less
    DOI: 10.3964/j.issn.1000-0593(2022)04-1323-06 Cite this Article
    Kai-yi ZHENG, Wen ZHANG, Fu-yuan DING, Chen-guang ZHOU, Ji-yong SHI, Marunaka Yoshinori, Xiao-bo ZOU. Using Ensemble Refinement (ER) Method to Optimize Transfer Set of Near-Infrared Spectra[J]. Spectroscopy and Spectral Analysis, 2022, 42(4): 1323 Copy Citation Text show less
    Illustrative example of the subset sampling in a transfer setThe black squares are the selected ones while the white ones not
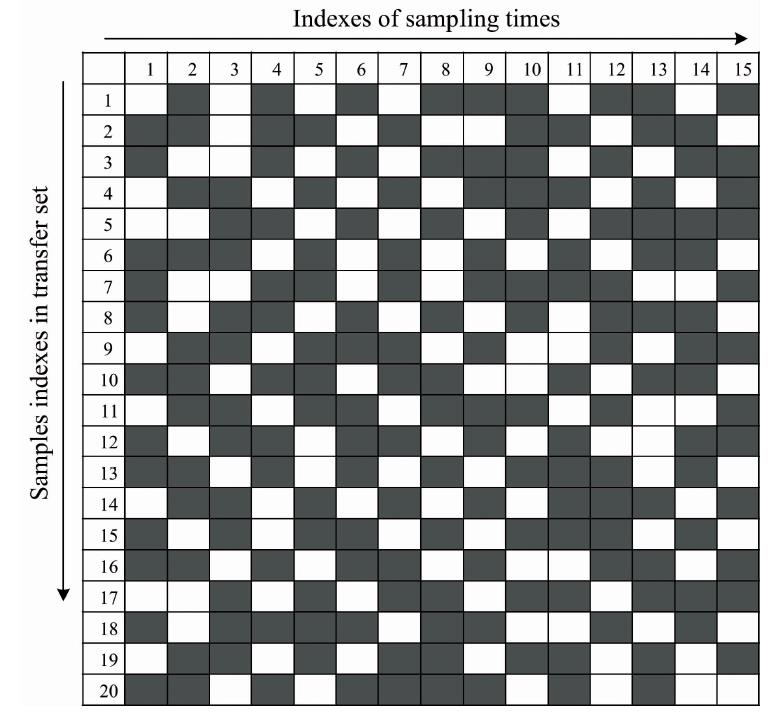
    Fig. 1. Illustrative example of the subset sampling in a transfer set
    The black squares are the selected ones while the white ones not
    The procedure of the ER method
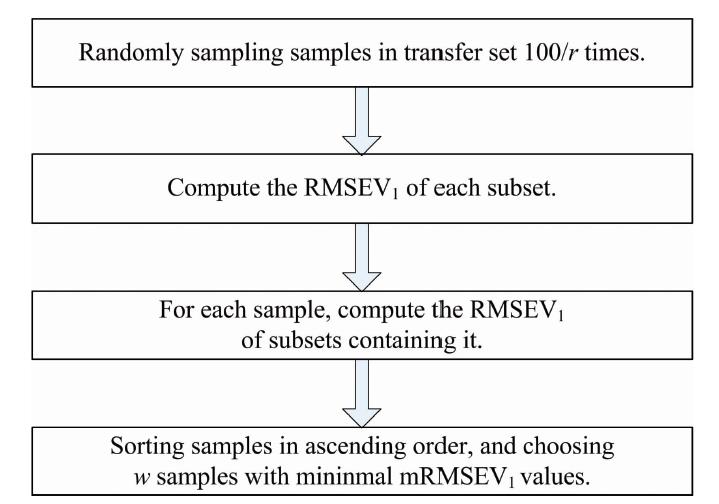
    Fig. 2. The procedure of the ER method
    The RMSEV2 of corn dataset at r from 0.2 to 0.9 (plots a to h) and m from 20 to 60In each plot, the blue and red lines represent RMSEV2 of the KS method and the proposed method, respectively
    Fig. 3. The RMSEV2 of corn dataset at r from 0.2 to 0.9 (plots a to h) and m from 20 to 60
    In each plot, the blue and red lines represent RMSEV2 of the KS method and the proposed method, respectively
    RMSEV2 of the corn dataset at r ranging from 0.3 to 0.9 at m=30
    Fig. 4. RMSEV2 of the corn dataset at r ranging from 0.3 to 0.9 at m=30
    Variation in RMSEV2 for subsets with w from 9 to 30 at m=30 and r=0.6
    Fig. 5. Variation in RMSEV2 for subsets with w from 9 to 30 at m=30 and r=0.6
    Average RMSEP of corn dataset at different values of m under the transfer set generated by KS (blue line) and ER (red line), respectively(a): CCA-ICE; (b): DS; (c): PDS; (d): SST
    Fig. 6. Average RMSEP of corn dataset at different values of m under the transfer set generated by KS (blue line) and ER (red line), respectively
    (a): CCA-ICE; (b): DS; (c): PDS; (d): SST
    Transfer
    methods
    Sample selection
    methods
    ParametersRMSEV2RMSEP
    CCA-ICEKSm=20, lCCA-ICE=90.049 20.094 6
    ERm=30, lCCA-ICE=9, w=280.017 90.077 5
    DSKSm=450.089 40.114 0
    ERm=45, w=410.057 00.089 2
    PDSKSm=45, wpds=90.310 00.392 0
    ERm=45, wpds=9, w=340.304 00.388 0
    SSTKSm=45, lSST=90.167 00.233 0
    ERm=45, lSST=9, w=340.085 80.120 0
    Table 1. Computation errors of corn dataset by KS and ER methods
    Kai-yi ZHENG, Wen ZHANG, Fu-yuan DING, Chen-guang ZHOU, Ji-yong SHI, Marunaka Yoshinori, Xiao-bo ZOU. Using Ensemble Refinement (ER) Method to Optimize Transfer Set of Near-Infrared Spectra[J]. Spectroscopy and Spectral Analysis, 2022, 42(4): 1323
    Download Citation