• Laser & Optoelectronics Progress
  • Vol. 57, Issue 10, 101003 (2020)
Liyuan Weng, Yatong Zhou*, Jingfei He, and Xiaolu Li
Author Affiliations
  • College of Electronic Information Engineering, Hebei University of Technology, Tianjin 300401, China
  • show less
    DOI: 10.3788/LOP57.101003 Cite this Article Set citation alerts
    Liyuan Weng, Yatong Zhou, Jingfei He, Xiaolu Li. Seismic Signal Denoising Based on Region Segmentation Gradient Histogram Preservation[J]. Laser & Optoelectronics Progress, 2020, 57(10): 101003 Copy Citation Text show less
    Flow chart of denoising based on SGHP algorithm
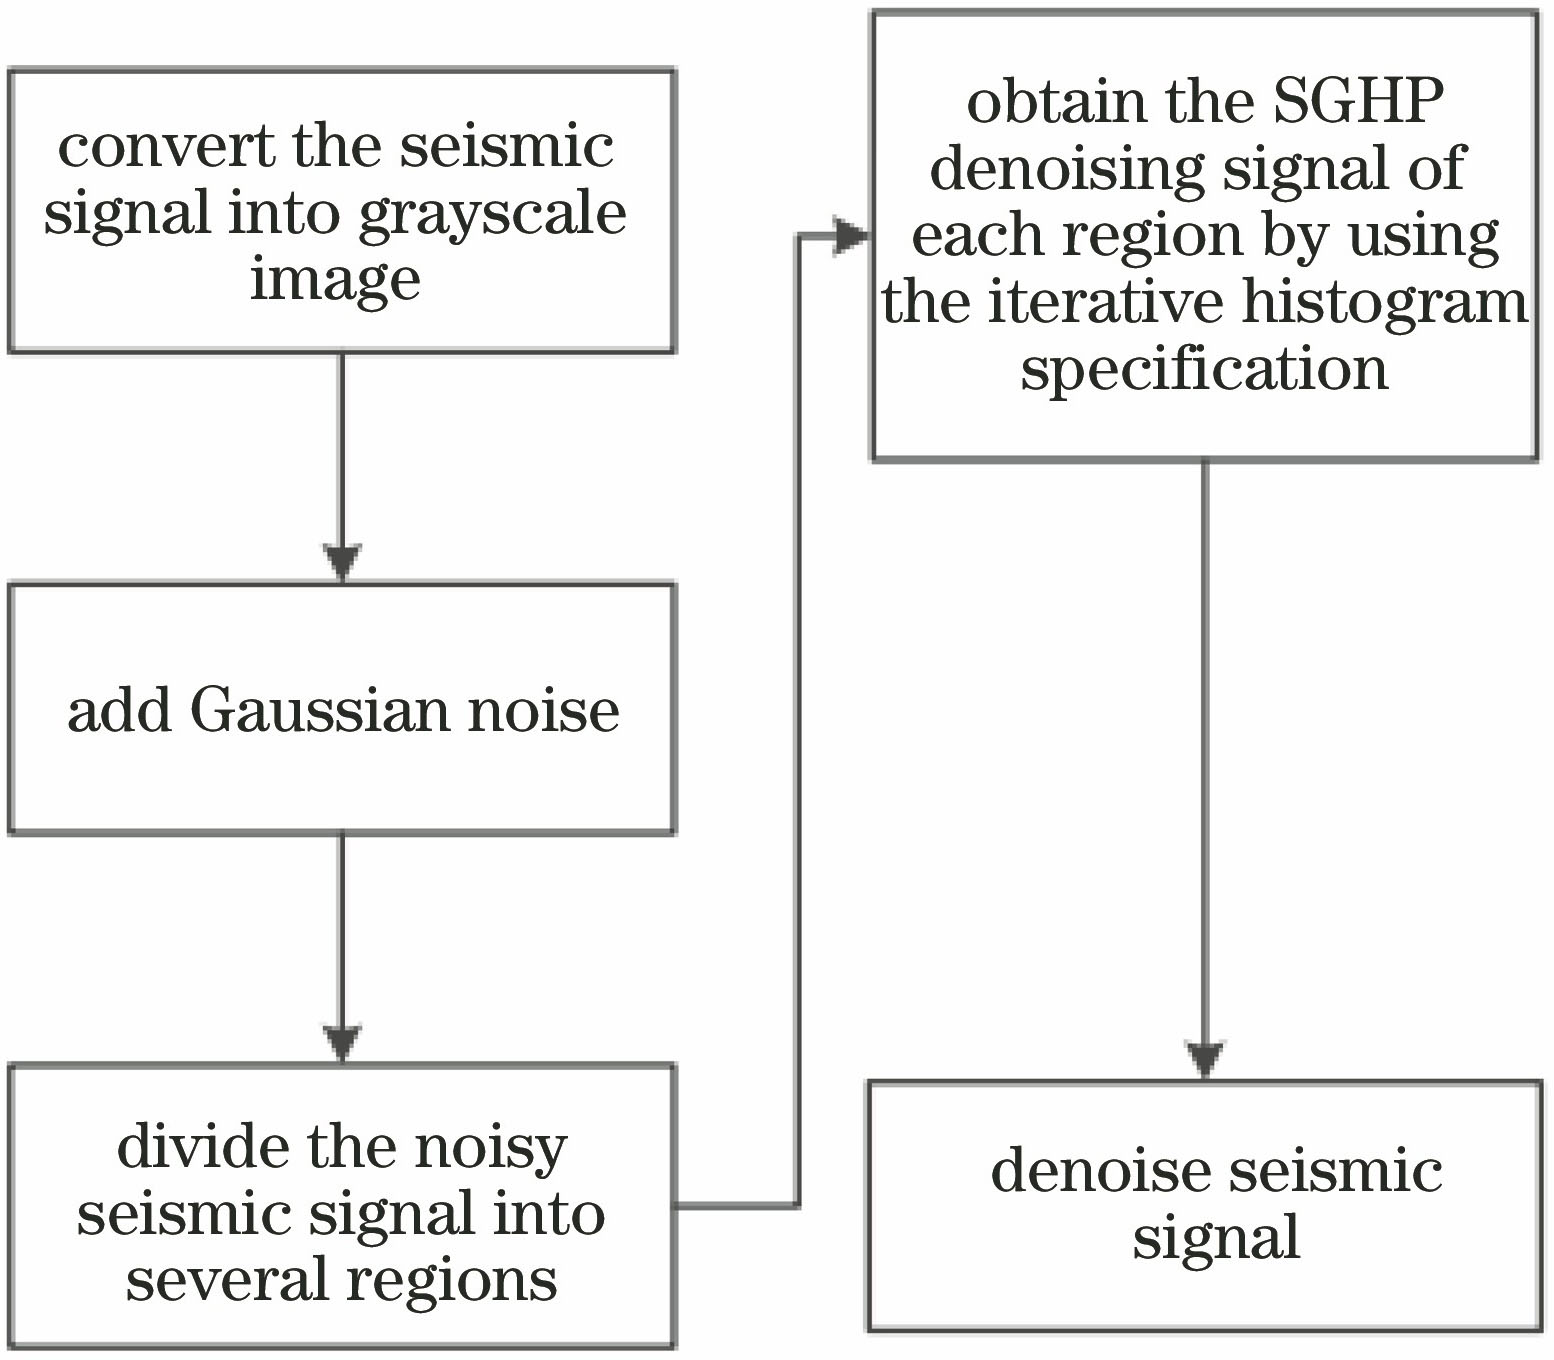
    Fig. 1. Flow chart of denoising based on SGHP algorithm
    Using K-means clustering to segment seismic signals with noise in different regions. (a) Region I; (b) region II
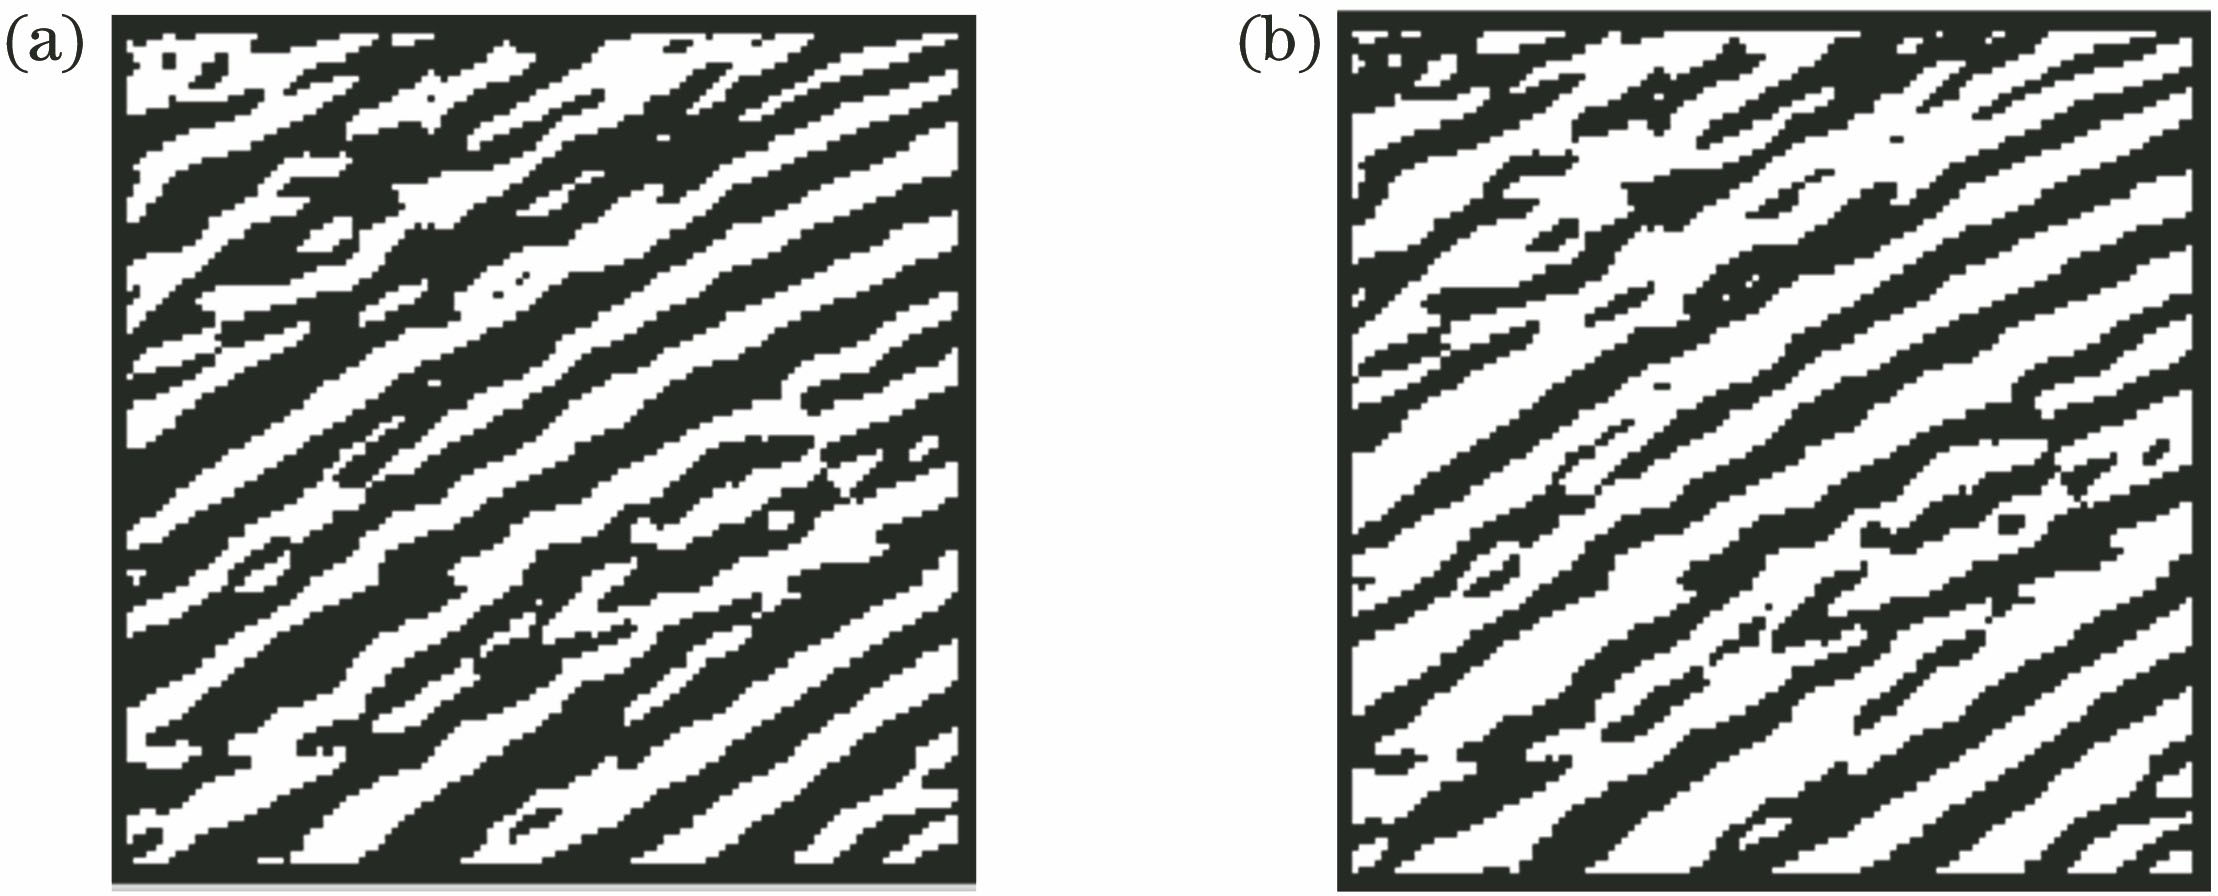
    Fig. 2. Using K-means clustering to segment seismic signals with noise in different regions. (a) Region I; (b) region II
    Gradient histogram estimation of two regions with noisy signal. (a) Region I; (b) region II
    Fig. 3. Gradient histogram estimation of two regions with noisy signal. (a) Region I; (b) region II
    SGHP denoising results
    Fig. 4. SGHP denoising results
    Denoising effects of the algorithms of NLM、 BM3D、 CSR, and SGHP on synthetic signal with 20% noise. (a) Original signal; (b) signal with 20% noise; (c) NLM denoising effect; (d) BM3D denoising effect; (e) CSR denoising effect; (f) SGHP denoising effect
    Fig. 5. Denoising effects of the algorithms of NLM、 BM3D、 CSR, and SGHP on synthetic signal with 20% noise. (a) Original signal; (b) signal with 20% noise; (c) NLM denoising effect; (d) BM3D denoising effect; (e) CSR denoising effect; (f) SGHP denoising effect
    Denoising effect of NLM, BM3D, CSR, and SGHP algorithms on post-stack land signal with 20% noise. (a) Original seismic signal; (b) Gaussian noise with 20% noise; (c) NLM denoising effect; (d) BM3D denoising effect; (e) CSR denoising effect; (f) SGHP denoising effect
    Fig. 6. Denoising effect of NLM, BM3D, CSR, and SGHP algorithms on post-stack land signal with 20% noise. (a) Original seismic signal; (b) Gaussian noise with 20% noise; (c) NLM denoising effect; (d) BM3D denoising effect; (e) CSR denoising effect; (f) SGHP denoising effect
    σ /%Input PSNR /dBAlgorithmDenoised PSNR /dBDenoised SSIM
    534.0777NLM23.57060.8657
    BM3D34.75330.9918
    CSR34.90520.9913
    SGHP34.60750.9909
    1028.0571NLM23.44060.8599
    BM3D29.90120.9664
    CSR29.72590.9694
    SGHP30.37600.9745
    1524.5353NLM23.23540.8537
    BM3D27.48420.9358
    CSR27.33760.9460
    SGHP28.07800.9564
    2022.0365NLM22.96520.8473
    BM3D25.96540.9071
    CSR25.88330.9238
    SGHP26.48390.9362
    2520.0983NLM22.64200.8397
    BM3D24.87010.8843
    CSR24.80610.9016
    SGHP25.36890.9170
    3028.5147NLM22.27780.8397
    BM3D23.97660.8650
    CSR23.95200.8795
    SGHP24.45530.8973
    Table 1. Add different levels of noise to the post-stack land signal, and compare the PSNR and SSIM values of each algorithm after denoising
    Liyuan Weng, Yatong Zhou, Jingfei He, Xiaolu Li. Seismic Signal Denoising Based on Region Segmentation Gradient Histogram Preservation[J]. Laser & Optoelectronics Progress, 2020, 57(10): 101003
    Download Citation