
Dalong Qi, Shian Zhang, Chengshuai Yang, Yilin He, Fengyan Cao, Jiali Yao, Pengpeng Ding, Liang Gao, Tianqing Jia, Jinyang Liang, Zhenrong Sun, Lihong V. Wang. Single-shot compressed ultrafast photography: a review[J]. Advanced Photonics, 2020, 2(1): 014003
- Advanced Photonics
- Vol. 2, Issue 1, 014003 (2020)
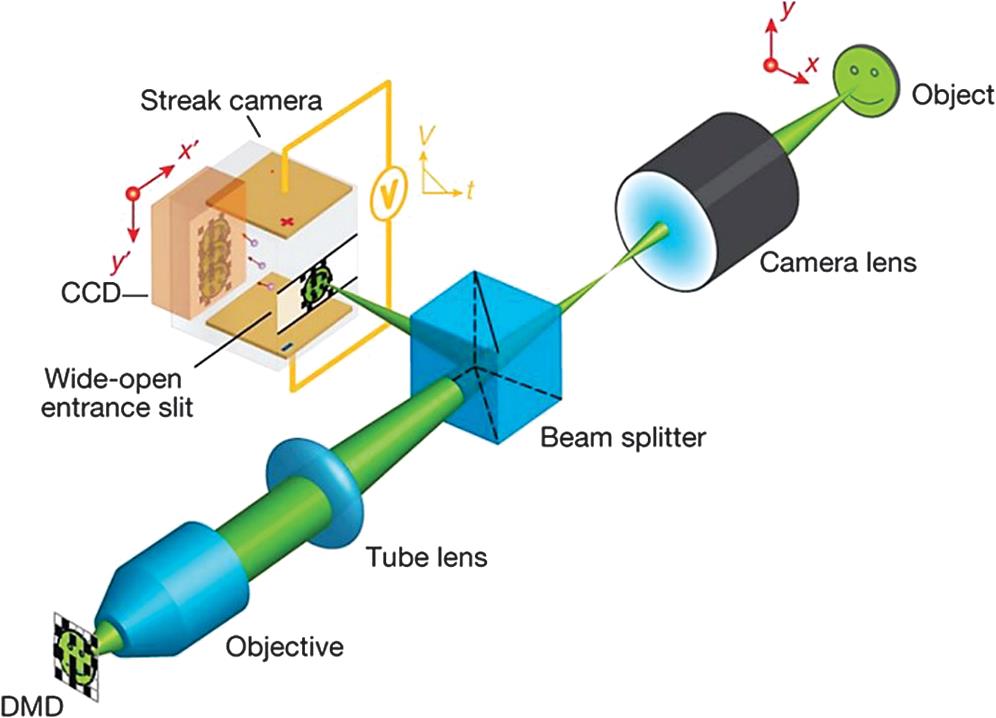
Fig. 1. CUP system configuration. CCD, charge-coupled device; DMD, digital micromirror device;
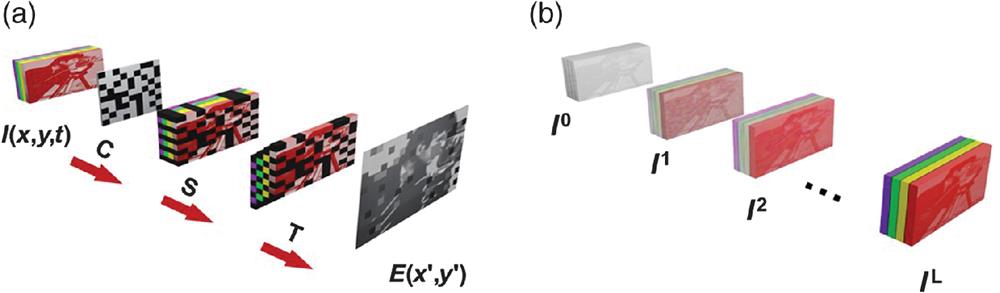
Fig. 2. Data flow of CUP in (a) data acquisition and (b) image reconstruction.
Fig. 3. (a) Flow chart for optimizing the encoding mask in a CUP system based on GA. (b), (c) The experimental results for a spatially modulated picosecond laser pulse evolution obtained by (b) optimal codes and (c) random codes. TwIST: two-step iterative shrinkage/thresholding.28 Figures reprinted from Ref. 29.
Fig. 4. A schematic diagram of data acquisition in multiencoding CUP. Here,
Fig. 5. Schematic diagram of the T-CUP system. Inset (black dashed box): detailed illustration of the streak tube. MCP, microchannel plate. Figure reprinted from Ref. 34.
Fig. 6. (a) An experimental diagram of imaging a superluminal propagation, showing experimental results obtained by the (b) AL algorithm and (c) TwIST algorithm. Figures reprinted from Ref. 36.
Fig. 7. The experimental results of imaging a picosecond laser pulse propagation. The frame at
Fig. 8. A schematic diagram of the CUST technique. Figure reprinted with permission from Ref. 43.
Fig. 9. The theoretical designs of (a) CUEDI, (b) CUTEM, and (c) dual-shearing CUTEM. Figures reprinted from Refs. 44 and 45.
Fig. 10. The experimental setup of COSUP. Figure reprinted from Ref. 46.
Fig. 11. (a) Spectral separation unit of the dual-color CUP system; (b) an ultrafast laser-induced fluorescence process revealed by dual-color CUP; (c) the photonic Mach cone dynamics obtained by LLE-CUP. Figures reprinted from Refs. 19 and 33.
Fig. 12. 3-D images of (a) static targets and (b) two-ball rotation, obtained by CUP. Figures reprinted from Ref. 35.
Fig. 13. Spatiotemporal evolutions of (a) a dual-color picosecond laser field and (b) the temporal focusing of a femtosecond laser pulse. Figures reprinted from Refs. 34 and 87.
Fig. 14. A schematic diagram of the experimental design of compressed 3-D image information secure communication. Figure reprinted from Ref. 107.

Set citation alerts for the article
Please enter your email address
© Copyright 2018-2021 | Chinese Laser Press. All Rights Reserved 沪ICP备15018463号-20