
Keding Yan, Liang Xue, Huachuan Huang, Shouyu Wang. Research and Design of Quantitative Interferometric Microscopic Cytometer[J]. Laser & Optoelectronics Progress, 2018, 55(12): 120901
- Laser & Optoelectronics Progress
- Vol. 55, Issue 12, 120901 (2018)
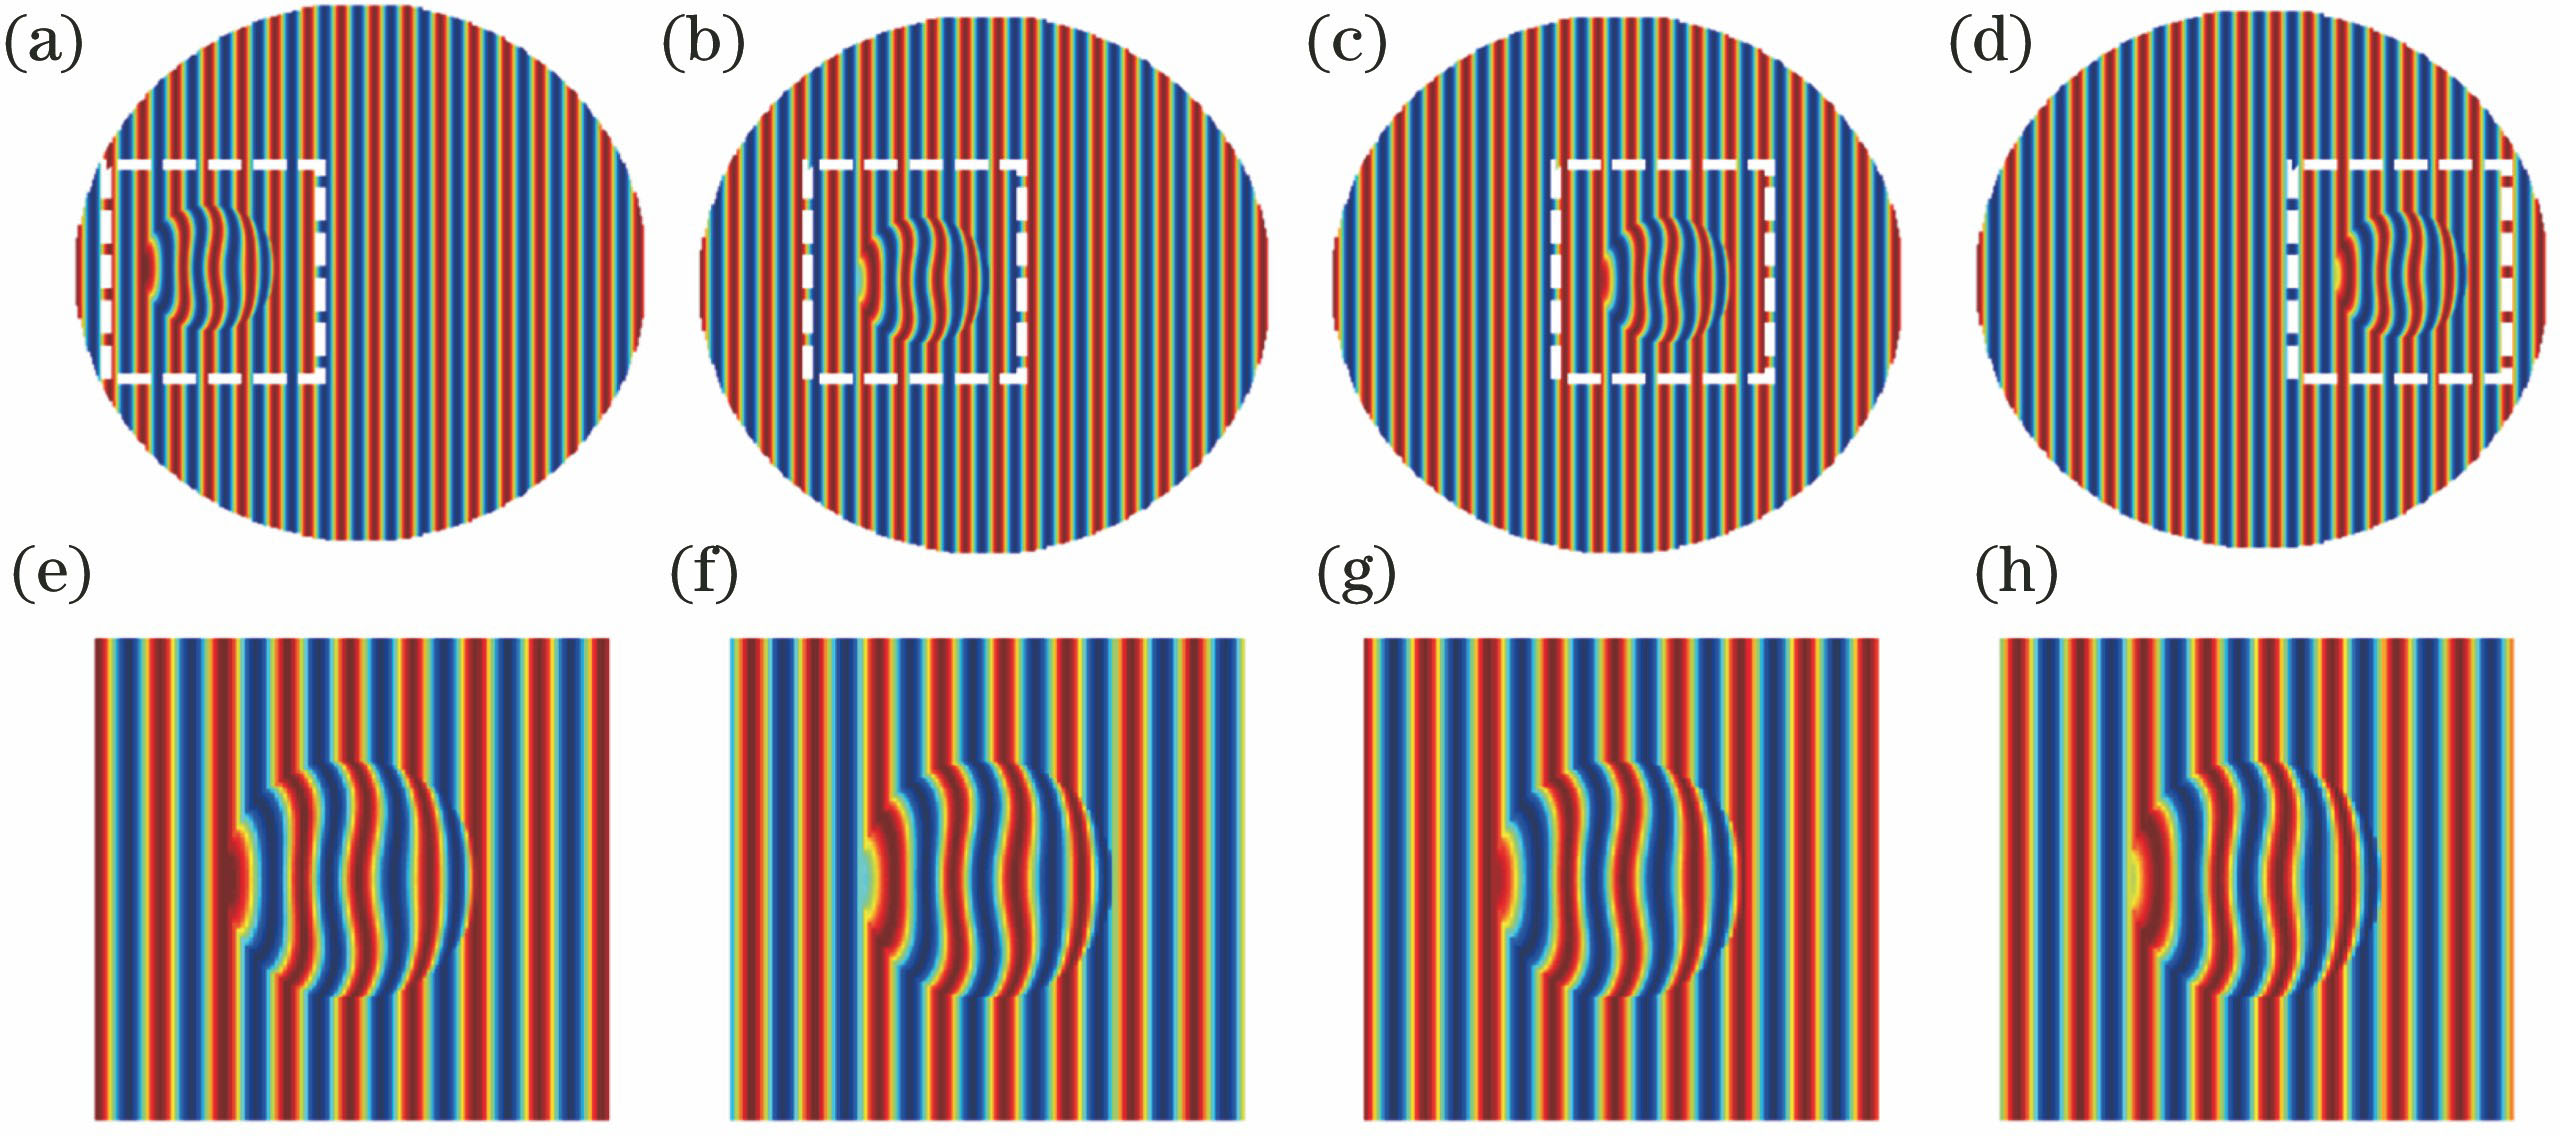
Fig. 1. (a)-(d) Red blood cells at different positions during field of view scanning; (e)-(h) interferograms in sub-field of view corresponding to those in dashed boxes of (a)-(d)
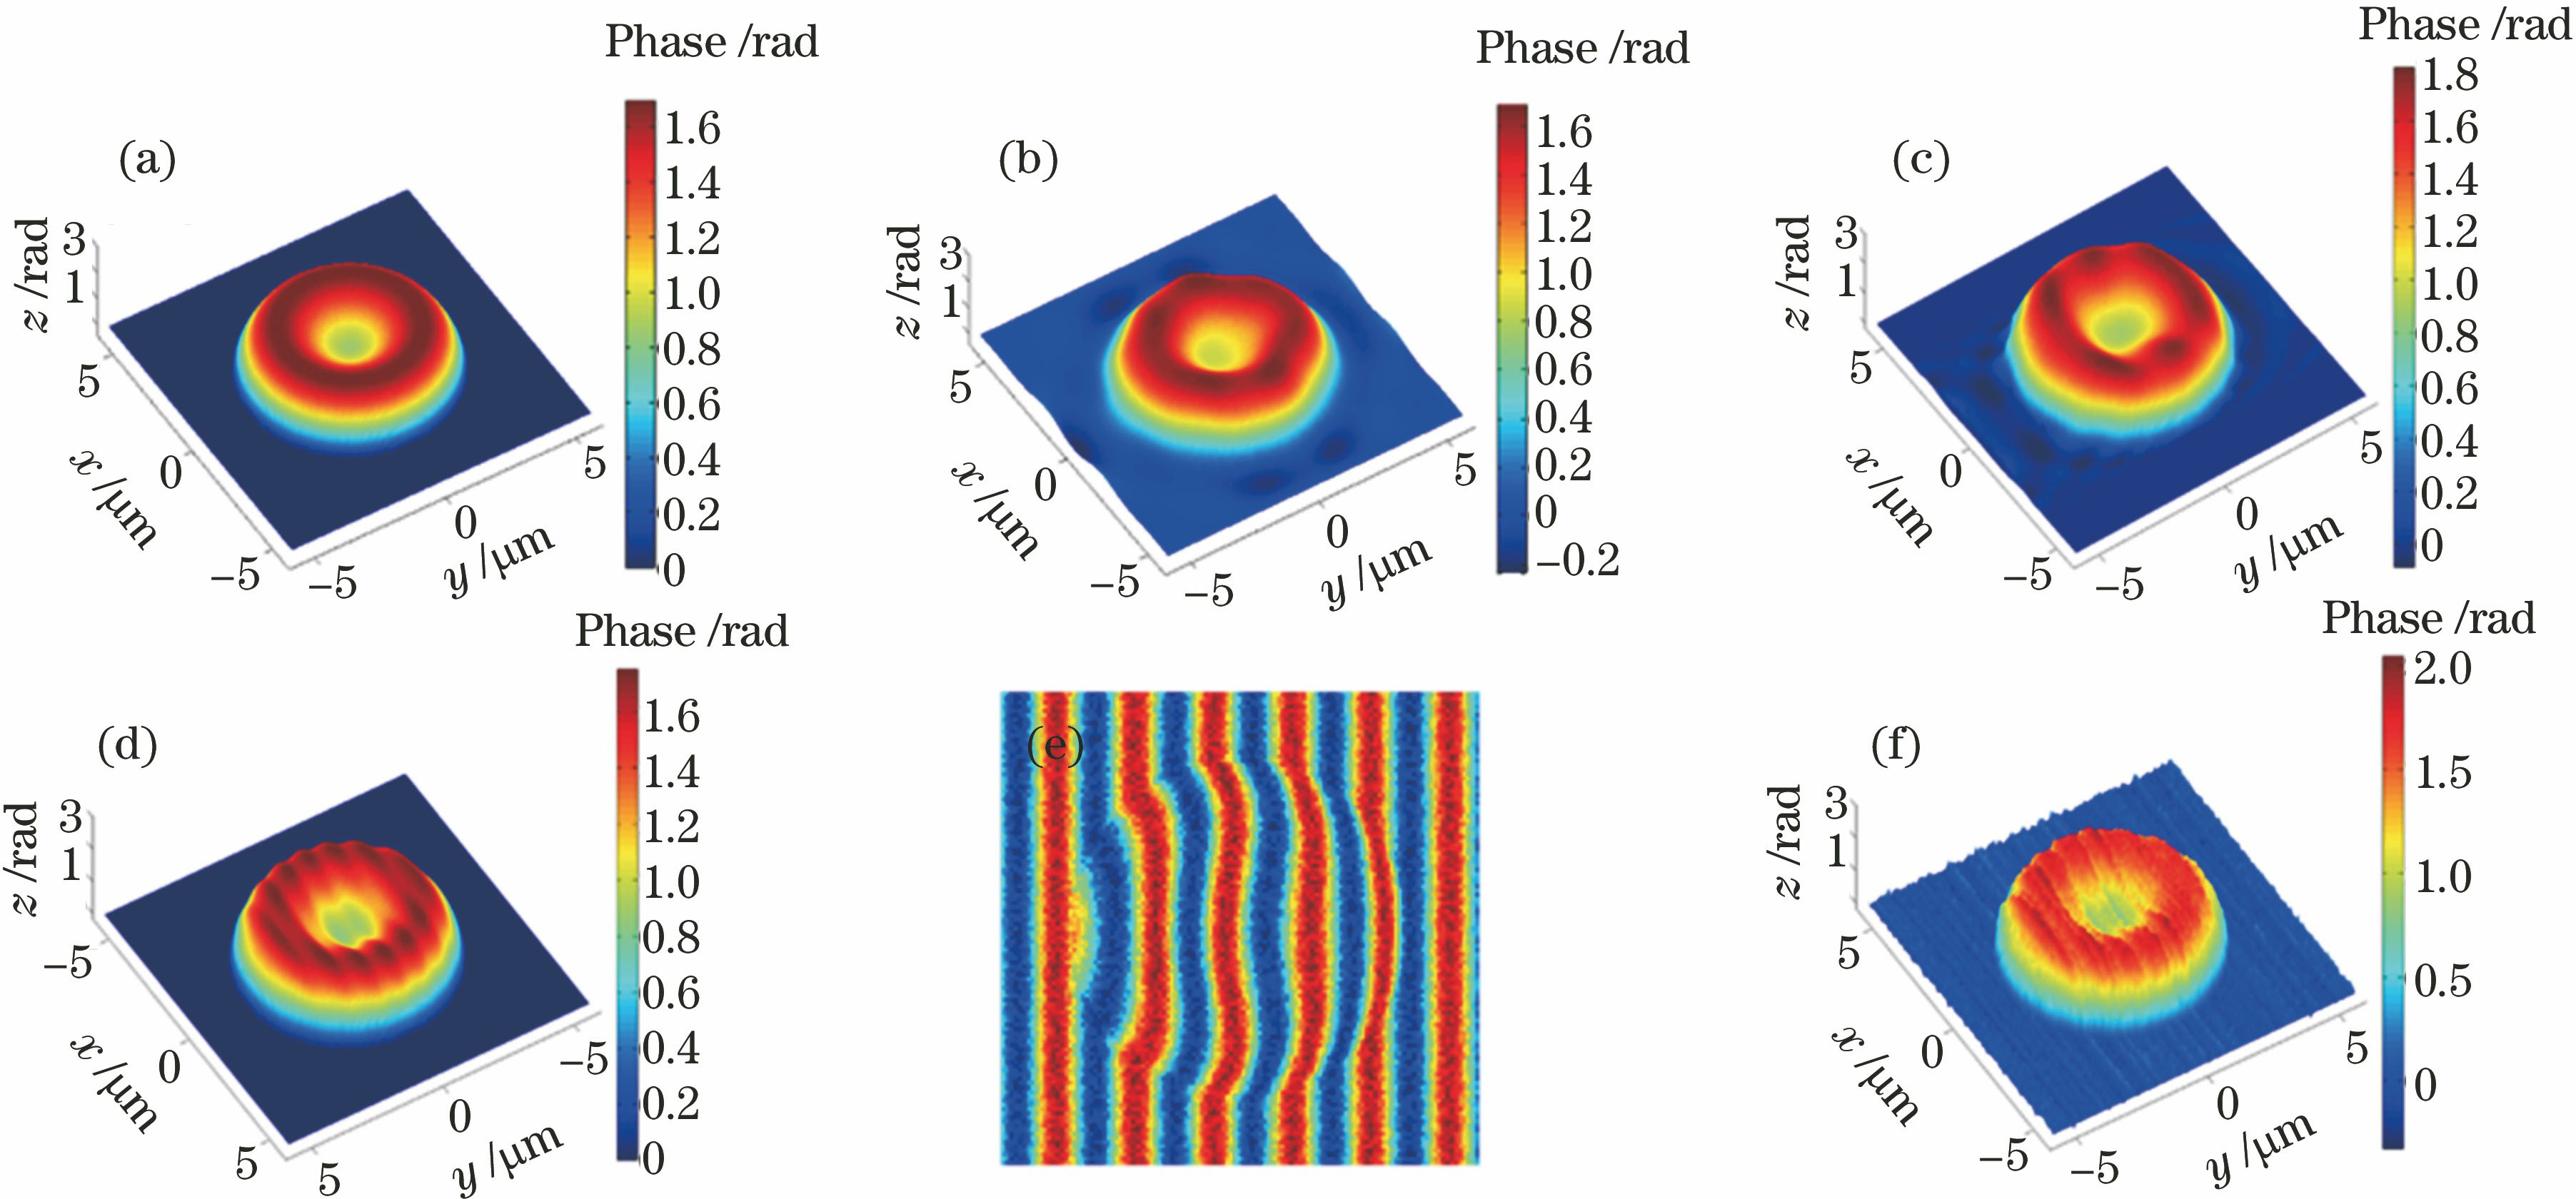
Fig. 2. Quantitative phase distributions of red blood cell model. (a) Quantitative phase distribution of red blood cell model obtained according to equation (2); (b) quantitative phase distribution recovered by traditional phase retrieval algorithm based on fast Fourier transform; (c) quantitative phase distribution recovered by traditional phase retrieval algorithm based on Hilbert transform; (d) quantitative phase distribution recovered by expanded principle component analysis phase retrieval algorith
Fig. 3. Scheme of quantitative interferometric microscopic cytometer based on mechanic field of view scanning
Fig. 4. (a) Interferograms captured by quantitative interferometric microscopic cytometer with phase retrieval algorithm based on expanded principle component analysis; (b) quantitative phase distribution of red blood cell after phase retrieval
Fig. 5. (a)(b) Red blood cells at different positions during field of view scanning; (c)(d) interferograms in sub-field of view corresponding to those in dashed boxes of (a) and (b); (e) phase of measured sample recovered by phase retrieval algorithm based on regularized optical flowing; (f) quantitative phase distribution of red blood cell model recovered by phase retrieval algorithm based on regularized optical flowing with noise
Fig. 6. (a) Processing steps of quantitative interferometric microscopic cytometer with phase retrieval algorithm based on regularized optical flowing; (b) the same batch of red blood cells at differential interferometric contrast microscopy; (c)-(e) quantitative phase distributions of the measured sample recovered by phase retrieval algorithm based on regularized optical flowing
Fig. 7. Schematic of gravity-driven quantitative interferometric microscopic cytometer
Fig. 8. Procedure of high-throughput and high-speed cell detection with gravity-driven quantitative interferometric microscopic cytometer
Fig. 9. (a) Same batch of red blood cell samples at differential interferometric contrast microscopy; (b)-(f) quantitative phase distributions of different red blood cells obtained by gravity-driven quantitative interferometric microscopic cytometer
Fig. 10. Parameters of measured red blood cells. (a) Phase volume and phase area (red line indicating linear fitting result); (b) circle-ratio and eccentricity
|
Table 1. Comparison among different quantitative interferometric microscopic cytometers

Set citation alerts for the article
Please enter your email address
© Copyright 2018-2021 | Chinese Laser Press. All Rights Reserved 沪ICP备15018463号-20