• Chinese Optics Letters
  • Vol. 19, Issue 8, 081406 (2021)
Karol Krzempek1、*, Dorota Tomaszewska1, Aleksandra Foltynowicz2, and Grzegorz Sobon1
Author Affiliations
  • 1Laser & Fiber Electronics Group, Faculty of Electronics, Wrocław University of Science and Technology, 50-370 Wroclaw, Poland
  • 2Department of Physics, Umeå University, 901 87 Umeå, Sweden
  • show less
    DOI: 10.3788/COL202119.081406 Cite this Article Set citation alerts
    Karol Krzempek, Dorota Tomaszewska, Aleksandra Foltynowicz, Grzegorz Sobon. Fiber-based optical frequency comb at 3.3 µm for broadband spectroscopy of hydrocarbons [Invited][J]. Chinese Optics Letters, 2021, 19(8): 081406 Copy Citation Text show less
    Schematic of the fiber-based mid-IR comb source. PD, piezo driver; PID, proportional integral derivative controller; LO, local oscillator; Mix, RF mixer; FC, fiber coupler; EDFA/YDFA, Er- or Yb-doped fiber amplifier; HNLF, highly nonlinear fiber; DCF, dispersion compensating fiber; ODL, fiberized optical delay line; PZT, piezoceramic fiber stretcher; PMF, polarization-maintaining single-mode fiber; COLL, collimator; GC, grating compressor; FL, focusing lens; PPLN, 3-mm-long periodically poled lithium niobite crystal; G, germanium filter; BS, beam splitter; DET, MCT detector; AMP, RF amplifier; LA, logarithmic amplifier. Fibers are indicated in black, and electrical connections are in green.
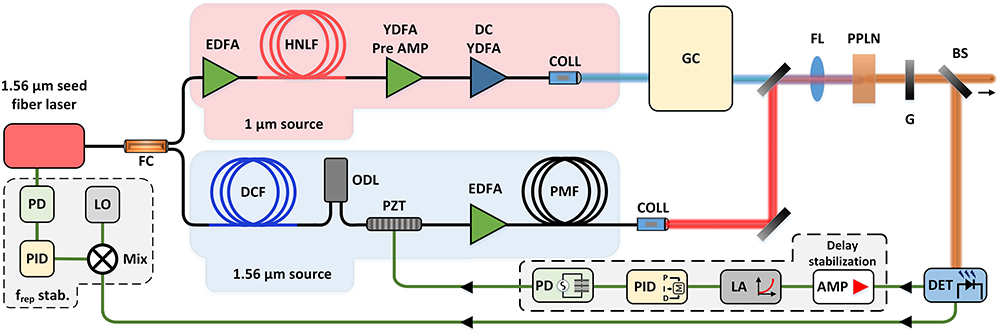
    Fig. 1. Schematic of the fiber-based mid-IR comb source. PD, piezo driver; PID, proportional integral derivative controller; LO, local oscillator; Mix, RF mixer; FC, fiber coupler; EDFA/YDFA, Er- or Yb-doped fiber amplifier; HNLF, highly nonlinear fiber; DCF, dispersion compensating fiber; ODL, fiberized optical delay line; PZT, piezoceramic fiber stretcher; PMF, polarization-maintaining single-mode fiber; COLL, collimator; GC, grating compressor; FL, focusing lens; PPLN, 3-mm-long periodically poled lithium niobite crystal; G, germanium filter; BS, beam splitter; DET, MCT detector; AMP, RF amplifier; LA, logarithmic amplifier. Fibers are indicated in black, and electrical connections are in green.
    Optical spectrum of the compressed 1565 nm pulses. The inset shows the measured autocorrelation trace.
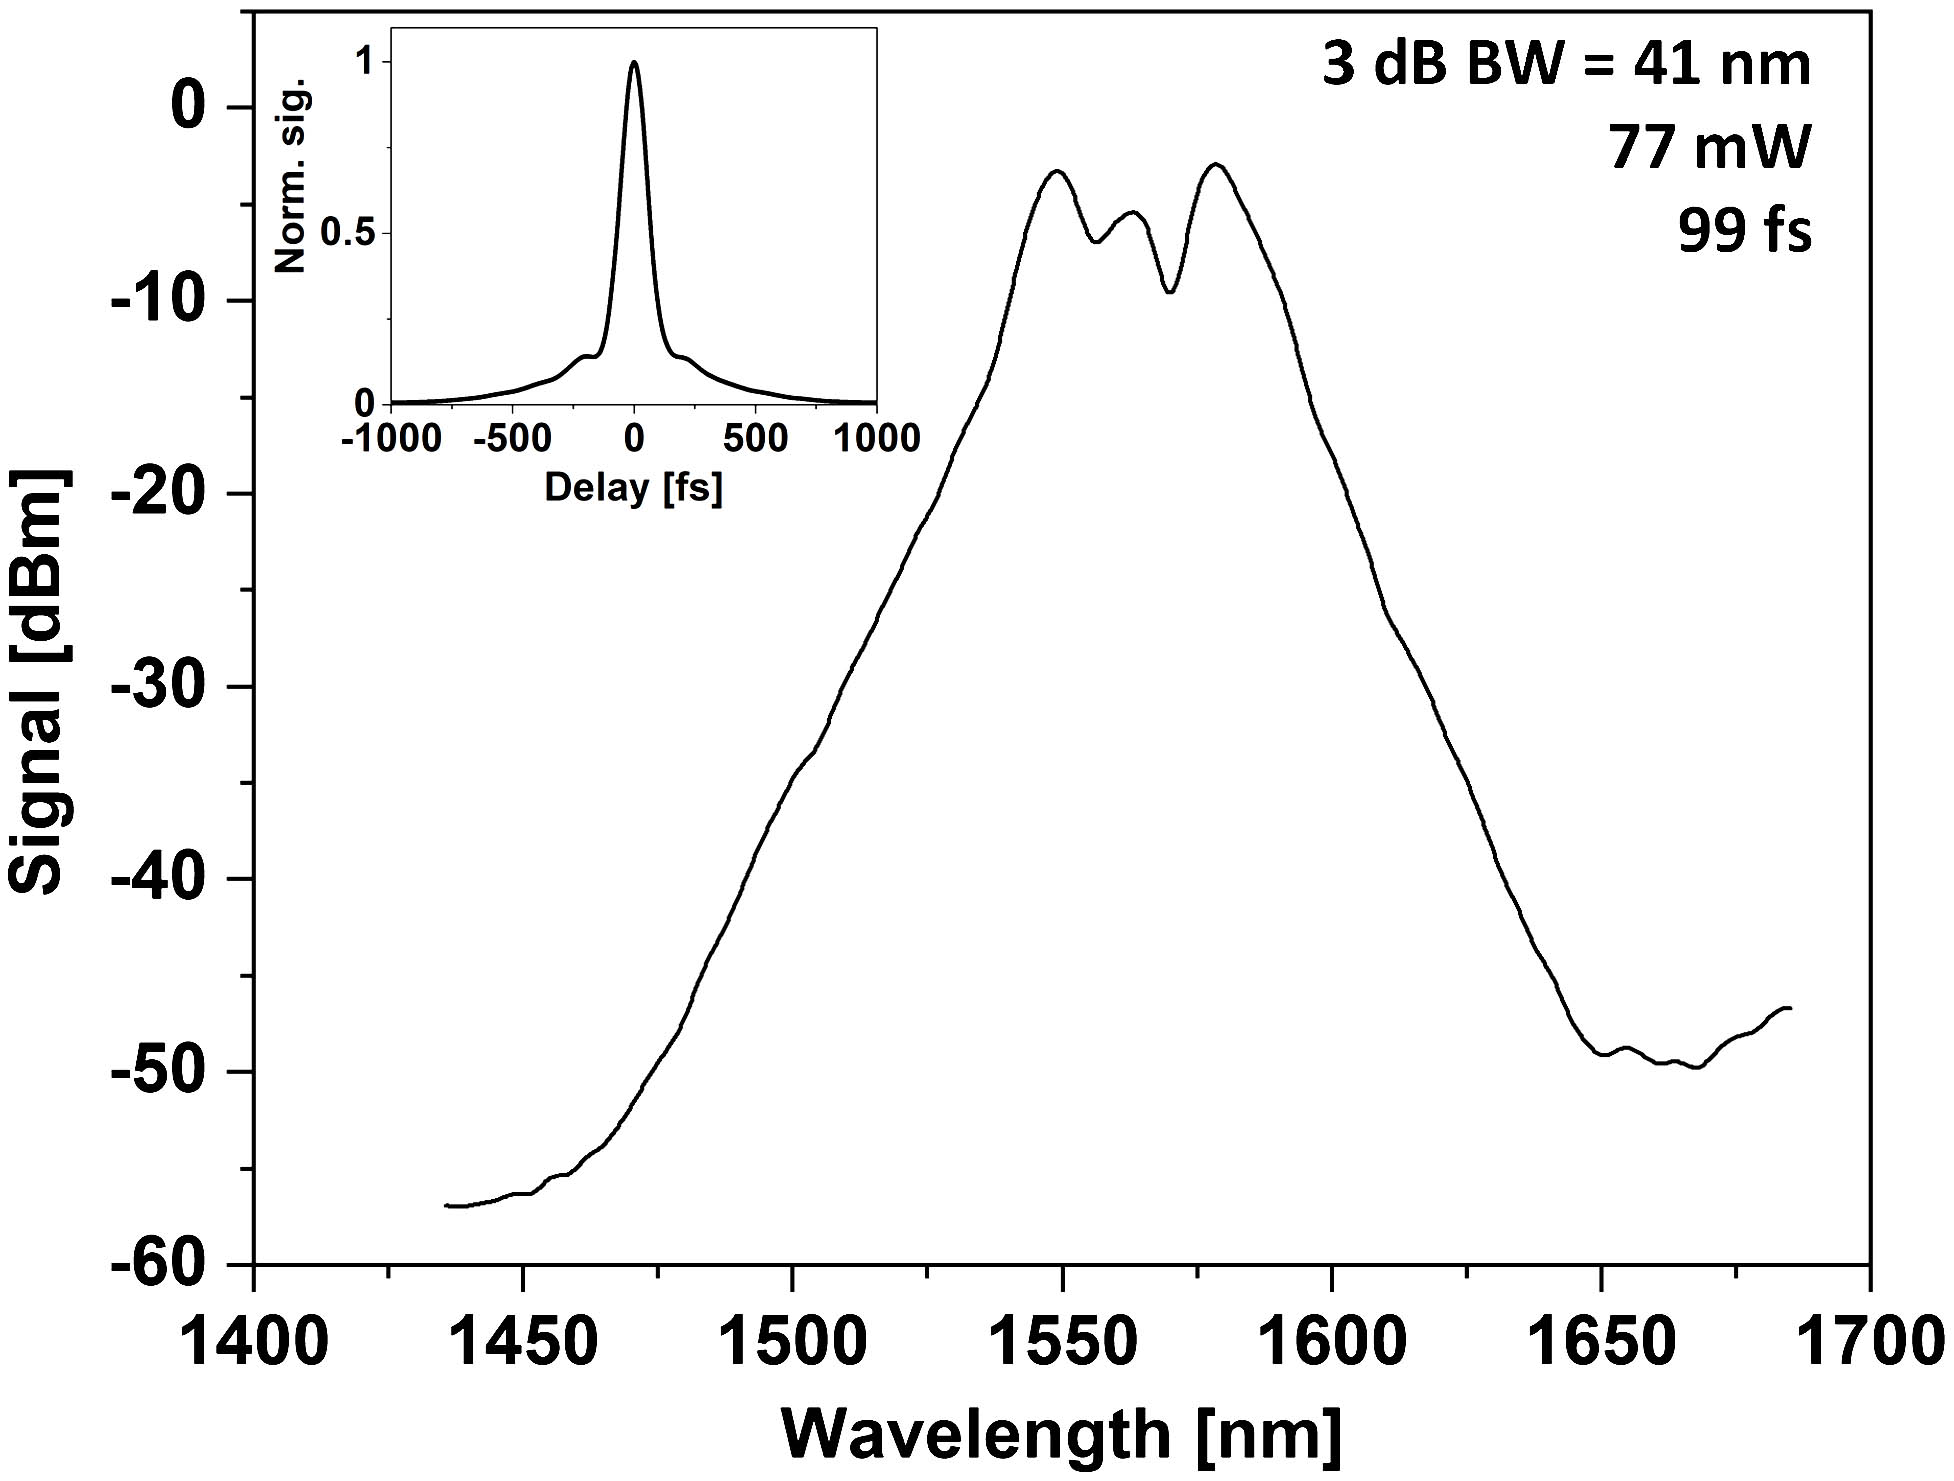
    Fig. 2. Optical spectrum of the compressed 1565 nm pulses. The inset shows the measured autocorrelation trace.
    Optical spectrum of the compressed 1 µm pulses. The inset shows the measured autocorrelation trace.
    Fig. 3. Optical spectrum of the compressed 1 µm pulses. The inset shows the measured autocorrelation trace.
    Generated optical spectra for different PPLN crystal periods, with average output power indicated in each measurement. Absorption lines of several molecules within the spectral coverage of the source are depicted in the upper panel.
    Fig. 4. Generated optical spectra for different PPLN crystal periods, with average output power indicated in each measurement. Absorption lines of several molecules within the spectral coverage of the source are depicted in the upper panel.
    (a) Heatmaps showing the time evolution of the spectrum for non-stabilized and stabilized cases. (b) Average output power stability as a function of time.
    Fig. 5. (a) Heatmaps showing the time evolution of the spectrum for non-stabilized and stabilized cases. (b) Average output power stability as a function of time.
    Absorption spectrum of CH4 and C2H6 measured using the DFG comb and a Fourier transform spectrometer (black) compared to the spectra of the two molecules (blue and red). The residuum of the fit is shown in the lower panel.
    Fig. 6. Absorption spectrum of CH4 and C2H6 measured using the DFG comb and a Fourier transform spectrometer (black) compared to the spectra of the two molecules (blue and red). The residuum of the fit is shown in the lower panel.
    Karol Krzempek, Dorota Tomaszewska, Aleksandra Foltynowicz, Grzegorz Sobon. Fiber-based optical frequency comb at 3.3 µm for broadband spectroscopy of hydrocarbons [Invited][J]. Chinese Optics Letters, 2021, 19(8): 081406
    Download Citation