• Laser & Optoelectronics Progress
  • Vol. 58, Issue 23, 2316001 (2021)
Xianglin Zhan and Shuwen Li*
Author Affiliations
  • College of Electronic Information and Automation, Civil Aviation University of China, Tianjin 300300, China
  • show less
    DOI: 10.3788/LOP202158.2316001 Cite this Article Set citation alerts
    Xianglin Zhan, Shuwen Li. Evaluation Method of Micro-Debonding Defects in FMLs Based on Local Defect Resonance[J]. Laser & Optoelectronics Progress, 2021, 58(23): 2316001 Copy Citation Text show less
    Nonlinear spring oscillator model
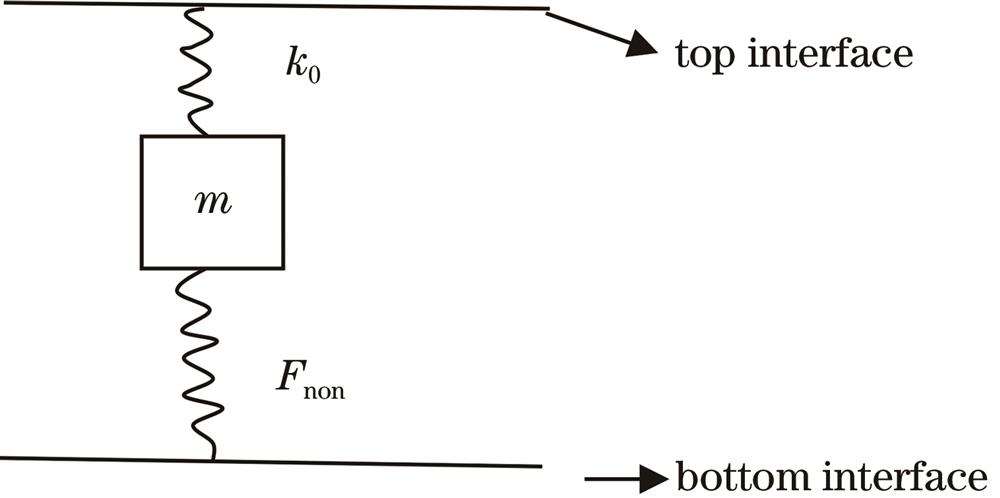
    Fig. 1. Nonlinear spring oscillator model
    Sweep signal
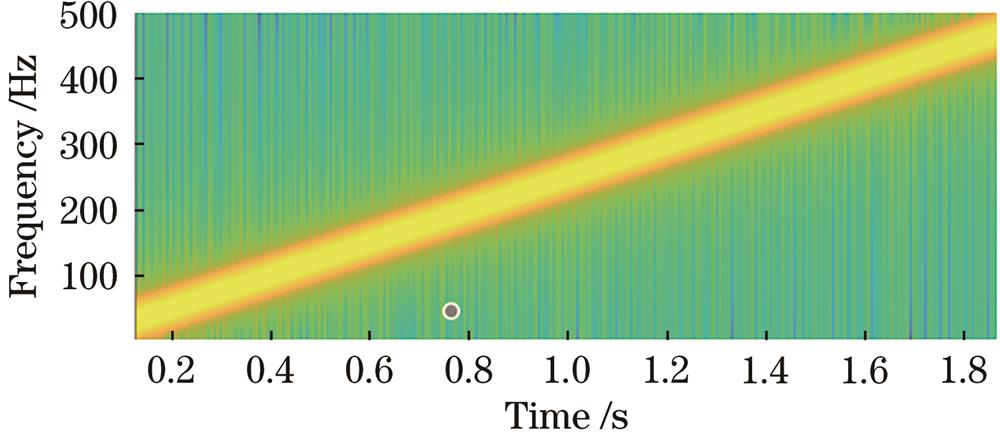
    Fig. 2. Sweep signal
    Sweep result
    Fig. 3. Sweep result
    Results of excitation at LDR frequency
    Fig. 4. Results of excitation at LDR frequency
    Results of excitation far away from LDR frequency
    Fig. 5. Results of excitation far away from LDR frequency
    Results of excitation at 2 times LDR frequency
    Fig. 6. Results of excitation at 2 times LDR frequency
    Detection experiment. (a) Detection circuit; (b) specimen to be tested
    Fig. 7. Detection experiment. (a) Detection circuit; (b) specimen to be tested
    Excitation results of specimen 6 at LDR frequency
    Fig. 8. Excitation results of specimen 6 at LDR frequency
    Excitation results of specimen 6 far away from LDR frequency
    Fig. 9. Excitation results of specimen 6 far away from LDR frequency
    Excitation results of specimen 6 at 2 times LDR frequency
    Fig. 10. Excitation results of specimen 6 at 2 times LDR frequency
    Amplitude of each component in echo response (excitation frequency is 40 kHz and excitation voltage is 1-90 V)
    Fig. 11. Amplitude of each component in echo response (excitation frequency is 40 kHz and excitation voltage is 1-90 V)
    Amplitude of each component in echo response (excitation frequency is 31.5 kHz and excitation voltage is 1-90 V)
    Fig. 12. Amplitude of each component in echo response (excitation frequency is 31.5 kHz and excitation voltage is 1-90 V)
    Comparison of preset and estimated damage equivalent radius of each group of specimens
    Fig. 13. Comparison of preset and estimated damage equivalent radius of each group of specimens
    Damage shapeLDR frequency /kHz
    Equivalent damage radius of 0.5 mmEquivalent damage radius of 0.75 mmEquivalent damage radius of 1 mmEquivalent damage radius of 1.5 mmEquivalent damage radius of 2 mm
    Average value464.6195.2116.860.331.0
    Circular466.8198.7120.163.031.5
    Irregular shape458.7200.2126.058.829.9
    Triangle450.6188.6109.360.629.6
    Square482.2193.1111.758.933.0
    Table 1. LDR frequency of each specimen with different damage sizes
    ParameterSimulated valueExperimental value
    Not at LDRAt LDRNot at LDRAt LDR
    β20.30.6630.240.54
    β'7.415.52.65.8
    Growth rate of β2121%125%
    Growth rate of β'109%123%
    Table 2. Simulated and experimental results under different detection conditions
    Group numberPreset equivalent damage radius /mmEstimated equivalent damage radius /mm
    10.50.521
    20.750.803
    311.039
    41.51.446
    522.020
    Table 3. Preset and estimated damage equivalent radius of each group of specimens
    Xianglin Zhan, Shuwen Li. Evaluation Method of Micro-Debonding Defects in FMLs Based on Local Defect Resonance[J]. Laser & Optoelectronics Progress, 2021, 58(23): 2316001
    Download Citation