• Laser & Optoelectronics Progress
  • Vol. 56, Issue 9, 092402 (2019)
Yuhuan Shuai1, Pan Qi2, Ying Li3, Cuiying Hu1, Mengjie Cai4, Yanhong Ran4, Shiping Li5、**, and Jingang Zhong5、*
Author Affiliations
  • 1 Department of Physics, College of Science and Engineering, Jinan University, Guangzhou Guangdong, 510632, China
  • 2 Department of Electronics Engineering, Guangdong Communication Polytechnic, Guangzhou, Guangdong 510650, China
  • 3 Pre-University, Jinan University, Guangzhou, Guangdong 510610, China
  • 4 Department of Bioengineering, College of Life Science and Technology, Jinan University, Guangzhou, Guangdong 510632, China
  • 5 Department of Optoelectronic Engineering, College of Science and Engineering, Jinan University, Guangzhou, Guangdong 510632, China
  • show less
    DOI: 10.3788/LOP56.092402 Cite this Article Set citation alerts
    Yuhuan Shuai, Pan Qi, Ying Li, Cuiying Hu, Mengjie Cai, Yanhong Ran, Shiping Li, Jingang Zhong. Detection of Interaction Between Peach-Gum Polysaccharides and Galectin-3 via Surface Plasmon Resonance Imaging[J]. Laser & Optoelectronics Progress, 2019, 56(9): 092402 Copy Citation Text show less
    Reflectivity and phase versus refractive index at incident angle of 70.58°
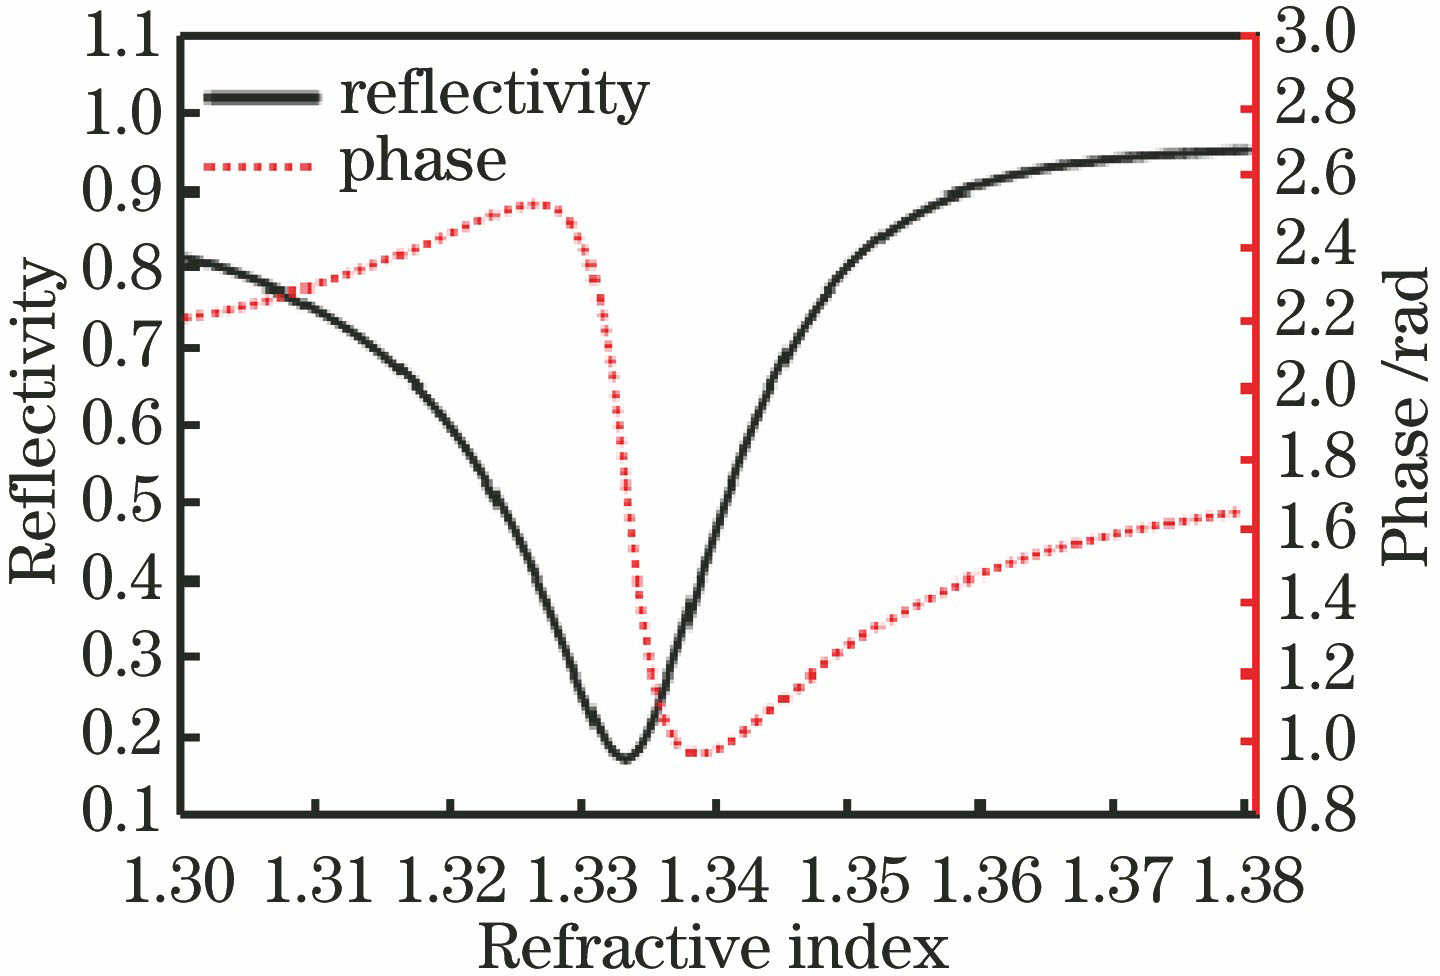
    Fig. 1. Reflectivity and phase versus refractive index at incident angle of 70.58°
    Reflectivity and phase versus sample thickness at incident angle of 70.58°
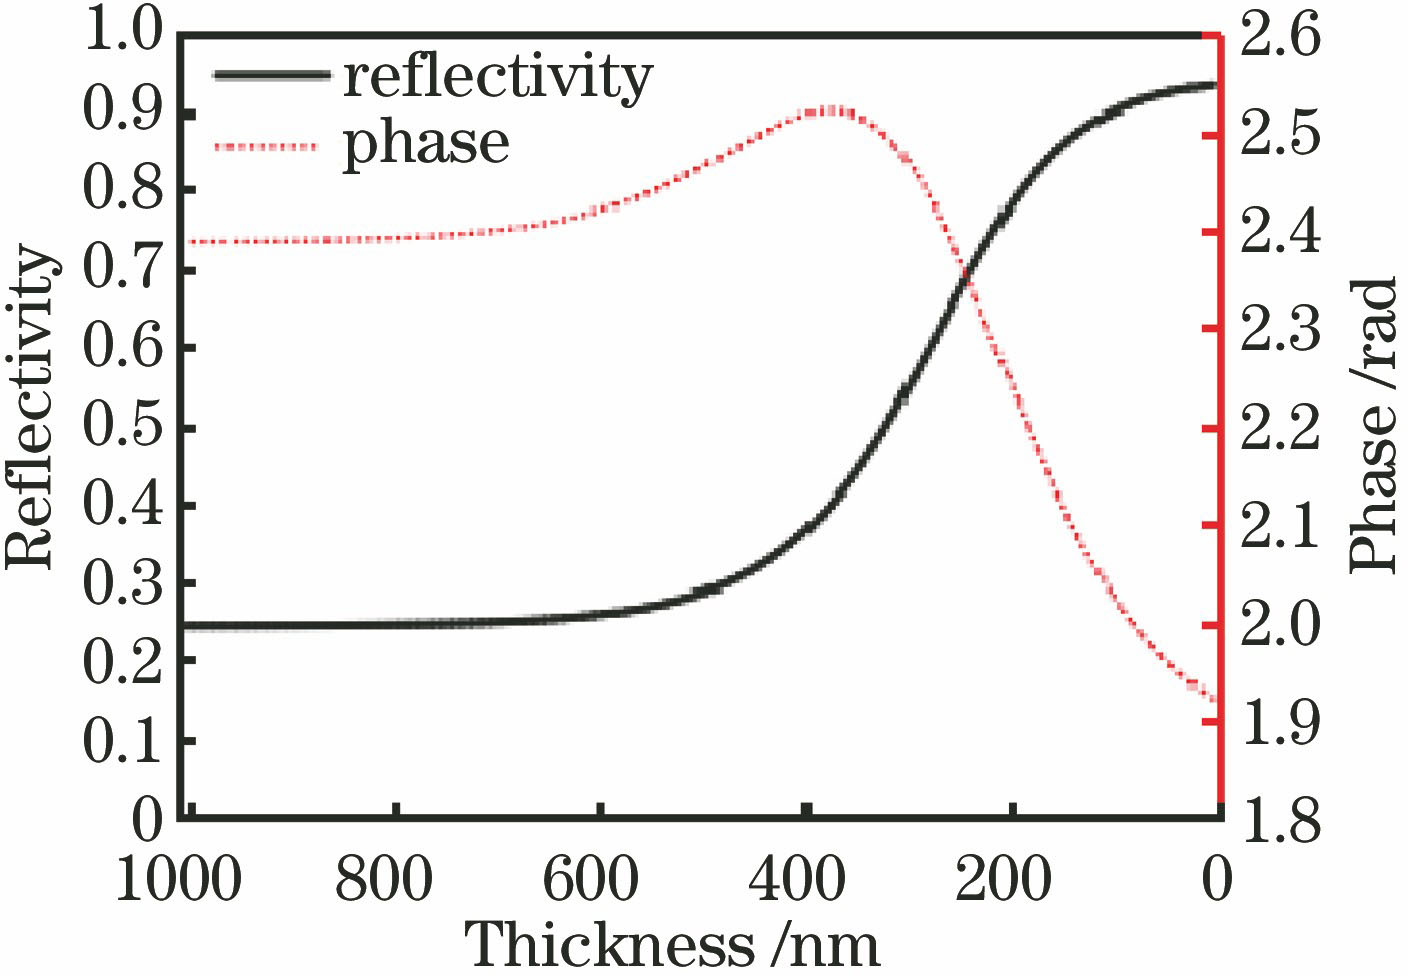
    Fig. 2. Reflectivity and phase versus sample thickness at incident angle of 70.58°
    Experimental device of SPRI
    Fig. 3. Experimental device of SPRI
    Physical map of experimental device
    Fig. 4. Physical map of experimental device
    Reflectivity and phase diagrams during water droplet evaporation. (a)(c)(e) Intensity diagrams; (b)(d)(f) phase diagrams
    Fig. 5. Reflectivity and phase diagrams during water droplet evaporation. (a)(c)(e) Intensity diagrams; (b)(d)(f) phase diagrams
    Rreflectivity and phase versus time during water droplet evaporation
    Fig. 6. Rreflectivity and phase versus time during water droplet evaporation
    Digital holograms, intensity images, and phase images recorded at 0 and 270 s. (a) Digital hologram at 0 s; (b) reconstructed intensity image at 0 s; (c) reconstructed phase image at 0 s; (d) three-dimensional (3D) representation of (b); (e) 3D representation of (c); (f) digital hologram at 270 s; (g) reconstructed intensity image at 270 s; (h) reconstructed phase image at 270 s; (i) 3D representation of (g); (j) 3D representation of (h)
    Fig. 7. Digital holograms, intensity images, and phase images recorded at 0 and 270 s. (a) Digital hologram at 0 s; (b) reconstructed intensity image at 0 s; (c) reconstructed phase image at 0 s; (d) three-dimensional (3D) representation of (b); (e) 3D representation of (c); (f) digital hologram at 270 s; (g) reconstructed intensity image at 270 s; (h) reconstructed phase image at 270 s; (i) 3D representation of (g); (j) 3D representation of (h)
    PGP-1 phase versus time
    Fig. 8. PGP-1 phase versus time
    Standard curve of PGP-1 reaction
    Fig. 9. Standard curve of PGP-1 reaction
    Calculated curve of binding rate for PGP-1 reaction
    Fig. 10. Calculated curve of binding rate for PGP-1 reaction
    PGP-2 phase versus time
    Fig. 11. PGP-2 phase versus time
    Standard curve of PGP-2 reaction
    Fig. 12. Standard curve of PGP-2 reaction
    Calculated curve of binding rate for PGP-2 reaction
    Fig. 13. Calculated curve of binding rate for PGP-2 reaction
    SampleBinding rate constant,ka /(M-s-)Binding equilibriumconstant, KA /M-
    PGP-1PGP-26663.403930.258.36×1051.24×105
    Table 1. Kinetic parameters
    Yuhuan Shuai, Pan Qi, Ying Li, Cuiying Hu, Mengjie Cai, Yanhong Ran, Shiping Li, Jingang Zhong. Detection of Interaction Between Peach-Gum Polysaccharides and Galectin-3 via Surface Plasmon Resonance Imaging[J]. Laser & Optoelectronics Progress, 2019, 56(9): 092402
    Download Citation