
Chen Yan, Li Zhongliang, Nan Nan, Bu Yang, Lu Yu, Song Siyu, Wang Xiangzhao. Wavelength Misalignment Analysis and Spectral Calibration for Fourier Domain Polarization-Sensitive Optical Coherence Tomography[J]. Chinese Journal of Lasers, 2018, 45(2): 207022
- Chinese Journal of Lasers
- Vol. 45, Issue 2, 207022 (2018)
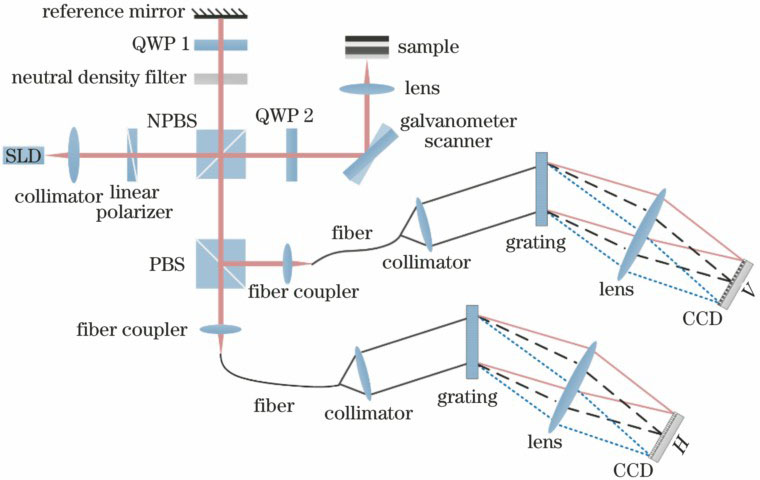
Fig. 1. Schematic of FD-PS-OCT system
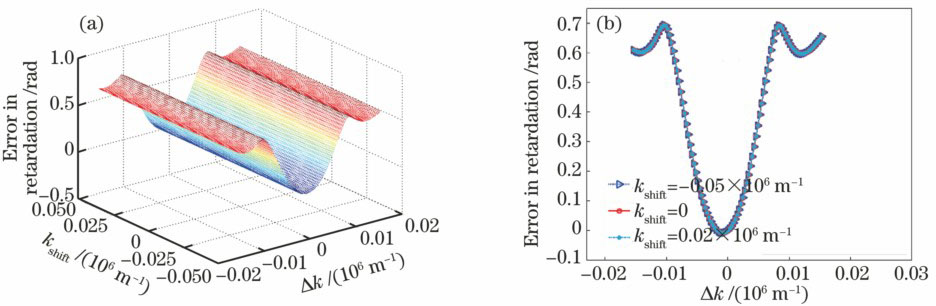
Fig. 2. Power spectrum of the light source
Fig. 3. Relative difference between wavenumbers
Fig. 4. Calculation error of retardation as a function of Δk and kshift. (a) Three-dimensional view of retardation error as a function of Δk and kshift; (b) retardation error as a function of Δk at different given kshift
Fig. 5. Calculation error of fast axis orientation as a function of Δk and kshift. (a) Three-dimensional view of fast axis orientation error as a function of Δk and kshift; (b) fast axis orientation error as a function of kshift at different given Δk
Fig. 6. Calculation errors of (a) retardation and (b) fast axis orientation as a function of depth z; (c) A-line signals of spectra H and V; (d) enlarged view of the dashed box in Fig. (c)
Fig. 7. Calculation errors of (a) retardation and (b) fast axis orientation as a function of depth z when the sampling point is 1024; calculation errors of (c) retardation and (d) fast axis orientation as a function of depth z when the sampling point is 4×1024
Fig. 8. Calibration results. (a) Wavenumber; (b) A-line signals
Fig. 9. Measurement results of a wave plate. (a) Measured retardation as a function of set fast axis orientation; (b) measured fast axis orientation as a function of set fast axis orientation
Fig. 10. Measurement results of a wave plate. (a) Measured retardation as a function of depth; (b) measured fast axis orientation as a function of depth

Set citation alerts for the article
Please enter your email address
© Copyright 2018-2021 | Chinese Laser Press. All Rights Reserved 沪ICP备15018463号-20