
[in Chinese], [in Chinese], [in Chinese], [in Chinese]. Development and application of mask modulated correlated imaging (Invited)[J]. Infrared and Laser Engineering, 2021, 50(12): 20210738
- Infrared and Laser Engineering
- Vol. 50, Issue 12, 20210738 (2021)
![(a) Schematic diagram of the Nipkow disk[47]; (b) Schematic diagram of the mask used in spectroscopic cameras in the 1970s[61]](/richHtml/irla/2021/50/12/20210738/img_1.jpg)
Fig. 1. (a) Schematic diagram of the Nipkow disk[47]; (b) Schematic diagram of the mask used in spectroscopic cameras in the 1970s[61]
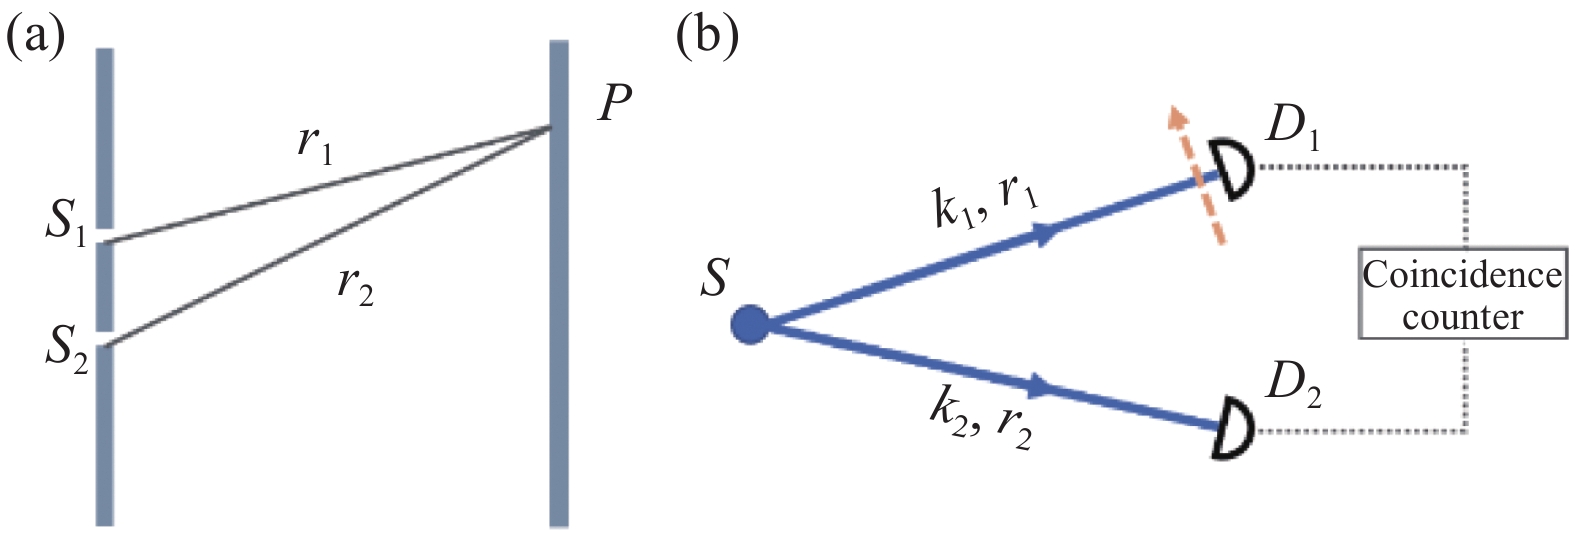
Fig. 2. (a) Schematic diagram of Young's double slit interference experiment; (b) Schematic diagram of the Hanbury Brown-Twiss stellar interferometer
Fig. 3. Schematic diagram of correlation imaging[65]
Fig. 4. Schematic diagram of imaging high-speed moving target based on single-pixel detector[68]
Fig. 5. Schematic diagram of ghost cytometry[69]
Fig. 6. Schematic diagram of ghost imaging LiDAR using push-broom scanning[70]
Fig. 7. Experimental setup of correlation imaging based on a rotating mask[16]
Fig. 8. Schematic diagram of the mask used in the experiment of Hayasaki et al[51]
Fig. 9. (a) Schematic diagram of the mask based on cyclic S matrix used in the Hahamovich et al experiment; (b) Part results of the experiment by Hahamovich et al[52]
Fig. 10. Schematic diagram of the mask used in the experiment of Vallés et al[50]
Fig. 11. Fig. (a) and Fig. (b) are schematic diagrams of masks used in the experiment of Jiang et al; (c) Simulation and experimental results[16]
Fig. 12. Experimental results of multispectral imaging by Jiang et al

Set citation alerts for the article
Please enter your email address
© Copyright 2018-2021 | Chinese Laser Press. All Rights Reserved 沪ICP备15018463号-20