• Photonics Research
  • Vol. 9, Issue 8, 1486 (2021)
Jaffar Kadum1、2、*, Ranjan Das1、3、*, Arijit Misra1, and Thomas Schneider1
Author Affiliations
  • 1THz-Photonics Group, Technische Universität Braunschweig, Schleinitzstraße 22, 38106 Braunschweig, Germany
  • 2e-mail: jaffar.kadum@ihf.tu-bs.de
  • 3e-mail: ranjan.das@ieee.org
  • show less
    DOI: 10.1364/PRJ.427691 Cite this Article Set citation alerts
    Jaffar Kadum, Ranjan Das, Arijit Misra, Thomas Schneider. Brillouin-scattering-induced transparency enabled reconfigurable sensing of RF signals[J]. Photonics Research, 2021, 9(8): 1486 Copy Citation Text show less
    (a) Schematic diagram of the proposed slow light-based spectrum discriminator; (b) simulated Brillouin gain spectrum (green) superimposed with a broad loss (blue), resulting in the orange net curve. The left inset represents the normalized SBS phase response for the gain (green), loss (blue), and the superposed spectrum (orange). The right inset is the corresponding normalized group index change of the superposed Brillouin spectrum.
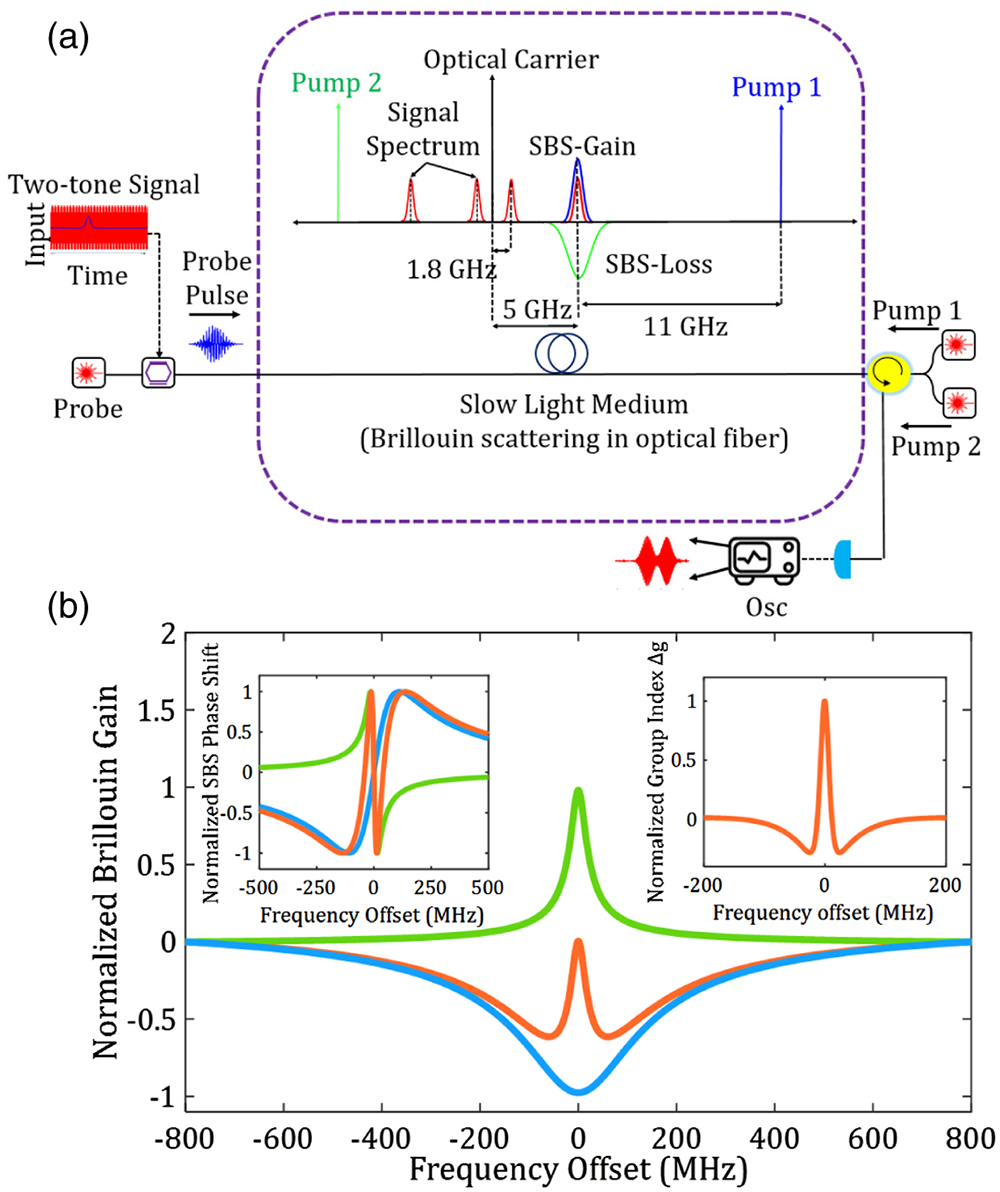
    Fig. 1. (a) Schematic diagram of the proposed slow light-based spectrum discriminator; (b) simulated Brillouin gain spectrum (green) superimposed with a broad loss (blue), resulting in the orange net curve. The left inset represents the normalized SBS phase response for the gain (green), loss (blue), and the superposed spectrum (orange). The right inset is the corresponding normalized group index change of the superposed Brillouin spectrum.
    (a) Normalized photodiode output of non-delayed reference pulse (blue) and optical (red) pulse delayed by 20 ns with a conventional Brillouin gain spectrum. The inset shows the zoomed-in section of the reference pulse, completely hidden by the delayed amplified pulse. (b) Measured delayed pulses by a Brillouin spectrum superposed with a broad loss (zero gain).
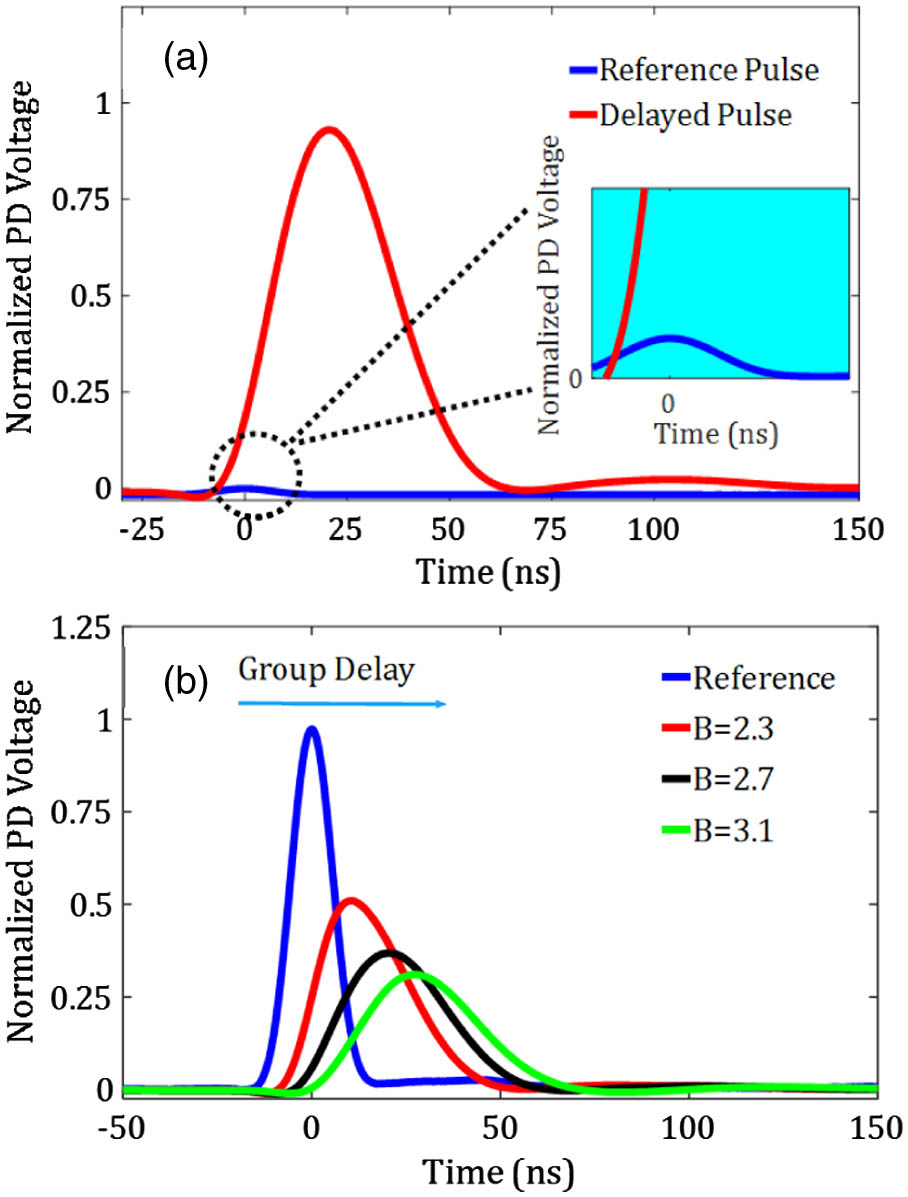
    Fig. 2. (a) Normalized photodiode output of non-delayed reference pulse (blue) and optical (red) pulse delayed by 20 ns with a conventional Brillouin gain spectrum. The inset shows the zoomed-in section of the reference pulse, completely hidden by the delayed amplified pulse. (b) Measured delayed pulses by a Brillouin spectrum superposed with a broad loss (zero gain).
    Experimental setup: DFB, distributed feedback laser; AWG, arbitrary waveform generator; RFG, radio frequency generator; MZM, Mach–Zehnder modulator; ISO, isolator; SMF, single-mode fiber; CIR, circulator; FBG, fiber Bragg grating; PC, polarization controller; OC, optical coupler; EDFA, erbium-doped fiber amplifier; PD, photodiode; OSA, optical spectrum analyzer; OSC, oscilloscope; VOA, variable optical attenuator; TC, temperature controller.
    Fig. 3. Experimental setup: DFB, distributed feedback laser; AWG, arbitrary waveform generator; RFG, radio frequency generator; MZM, Mach–Zehnder modulator; ISO, isolator; SMF, single-mode fiber; CIR, circulator; FBG, fiber Bragg grating; PC, polarization controller; OC, optical coupler; EDFA, erbium-doped fiber amplifier; PD, photodiode; OSA, optical spectrum analyzer; OSC, oscilloscope; VOA, variable optical attenuator; TC, temperature controller.
    Measured superposed Brillouin spectrum, BLS, Brillouin loss spectrum; BGS, Brillouin gain spectrum. The cyan region represents the natural Brillouin spectrum in which the delay takes place.
    Fig. 4. Measured superposed Brillouin spectrum, BLS, Brillouin loss spectrum; BGS, Brillouin gain spectrum. The cyan region represents the natural Brillouin spectrum in which the delay takes place.
    Experimental characterization of the (a) pulse broadening and (b) fractional time delay in dependence on the Brillouin gain. The solid curves give the analytical results and the red squares or dots the measured values.
    Fig. 5. Experimental characterization of the (a) pulse broadening and (b) fractional time delay in dependence on the Brillouin gain. The solid curves give the analytical results and the red squares or dots the measured values.
    Measured PD output (after dc blocking) of the two-tone (1.8 and 5 GHz) signal before applying the group delay (pump is off). The inset is the corresponding measured RF spectrum.
    Fig. 6. Measured PD output (after dc blocking) of the two-tone (1.8 and 5 GHz) signal before applying the group delay (pump is off). The inset is the corresponding measured RF spectrum.
    (a) Output RF signal (after dc removal) for the delay of the 5 GHz signal after broadening compensation and amplitude normalization. The inset shows the raw data before compensation. (b) Spectrogram (time–frequency mapping) of the output signal in (a).
    Fig. 7. (a) Output RF signal (after dc removal) for the delay of the 5 GHz signal after broadening compensation and amplitude normalization. The inset shows the raw data before compensation. (b) Spectrogram (time–frequency mapping) of the output signal in (a).
    (a) Output RF signal (after dc removal) for delaying the 1.8 GHz signal against the 5 GHz; (b) spectrogram of the output signal in (a); (c) separation between 5 GHz and 0.9 GHz signals (5 GHz is delayed); and (d) spectrogram of the output signal in (c).
    Fig. 8. (a) Output RF signal (after dc removal) for delaying the 1.8 GHz signal against the 5 GHz; (b) spectrogram of the output signal in (a); (c) separation between 5 GHz and 0.9 GHz signals (5 GHz is delayed); and (d) spectrogram of the output signal in (c).
    Jaffar Kadum, Ranjan Das, Arijit Misra, Thomas Schneider. Brillouin-scattering-induced transparency enabled reconfigurable sensing of RF signals[J]. Photonics Research, 2021, 9(8): 1486
    Download Citation