• Photonics Research
  • Vol. 10, Issue 9, 2247 (2022)
You Zhou1、†, Bo Xiong2、3、†, Weizhi Song1, Xu Zhang4, Guoan Zheng5, Qionghai Dai2、3、6、*, and Xun Cao1、7、*
Author Affiliations
  • 1School of Electronic Science and Engineering, Nanjing Universityhttps://ror.org/01rxvg760, Nanjing 210023, China
  • 2Department of Automation, Tsinghua University, Beijing 100084, China
  • 3Institute for Brain and Cognitive Sciences, Tsinghua University, Beijing 100084, China
  • 4Beijing Institute of Collaborative Innovation, Beijing 100094, China
  • 5Department of Biomedical Engineering, University of Connecticut, Storrs, Connecticut 06269, USA
  • 6e-mail: qhdai@mail.tsinghua.edu.cn
  • 7e-mail: caoxun@nju.edu.cn
  • show less
    DOI: 10.1364/PRJ.464051 Cite this Article Set citation alerts
    You Zhou, Bo Xiong, Weizhi Song, Xu Zhang, Guoan Zheng, Qionghai Dai, Xun Cao. Light-field micro-endoscopy using a fiber bundle: a snapshot 3D epi-fluorescence endoscope[J]. Photonics Research, 2022, 10(9): 2247 Copy Citation Text show less
    Principle of LFME. (a) Light-field micro-endoscopy (LFME) imaging scheme. The compact LFME system mainly consists of a small-size imaging lens pair, a small-size micro-lens array (MLA), and a single-mode fiber bundle (SMFB). Zoom-in panel ① shows the relationship of a sample space point with the native image plane (NIP). Zoom-in panel ② shows the enlarged image of the excitation light passing through the fiber distal end to the MLA plane and the emission light passing back. Note that on the illumination side, we use a rotating diffuser to weaken the spatial coherence of the laser source and reduce the speckle noise. (b) Cross-section image and its enlarged view of the SMFB (top), and the real image pattern and its enlarged view of the entire LFME system (bottom). (c) Experimental performance test by imaging randomly distributed fluorescent beads. The lateral and axial maximum intensity projections (MIPs) of beads are shown, after performing the Richardson–Lucy (RL) deconvolution. The resolved FWHM is 6.06 μm in the x direction and 35.40 μm in the z direction. A zoom-in image of the green box in the z−y MIP image is also shown here, which indicates two beads with ∼10.35 μm depth distance, exhibiting the 3D imaging capability.
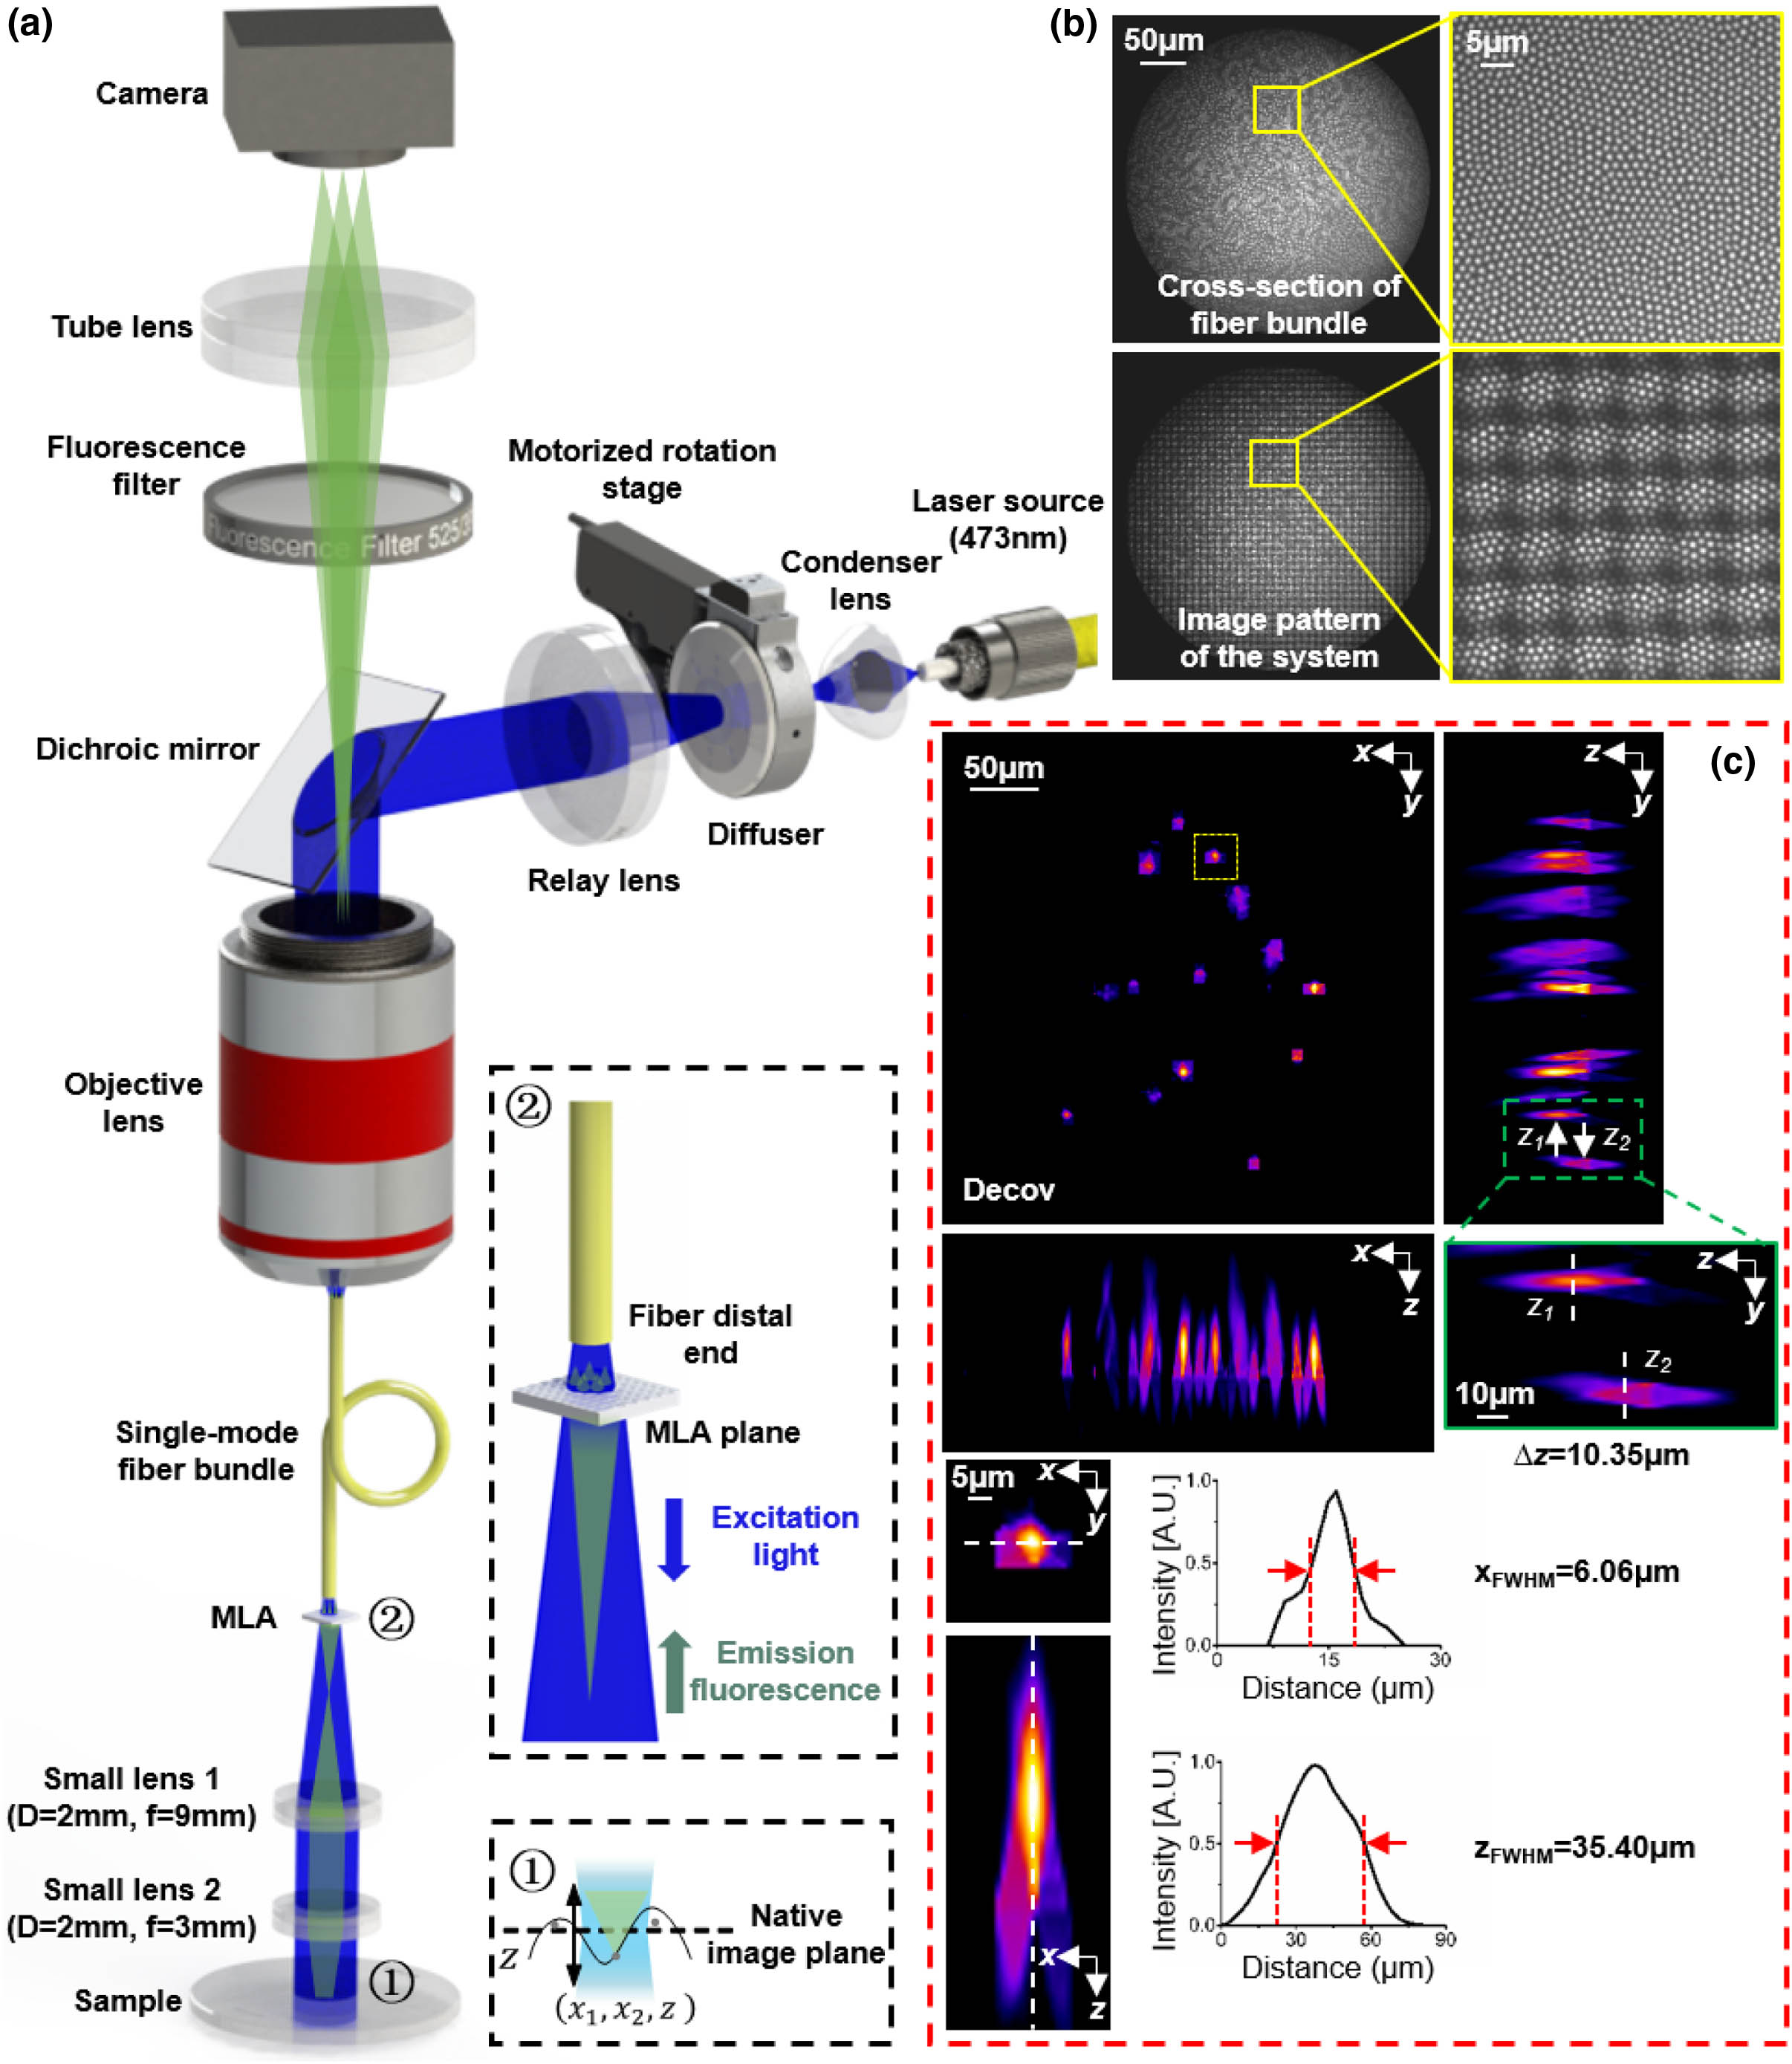
    Fig. 1. Principle of LFME. (a) Light-field micro-endoscopy (LFME) imaging scheme. The compact LFME system mainly consists of a small-size imaging lens pair, a small-size micro-lens array (MLA), and a single-mode fiber bundle (SMFB). Zoom-in panel ① shows the relationship of a sample space point with the native image plane (NIP). Zoom-in panel ② shows the enlarged image of the excitation light passing through the fiber distal end to the MLA plane and the emission light passing back. Note that on the illumination side, we use a rotating diffuser to weaken the spatial coherence of the laser source and reduce the speckle noise. (b) Cross-section image and its enlarged view of the SMFB (top), and the real image pattern and its enlarged view of the entire LFME system (bottom). (c) Experimental performance test by imaging randomly distributed fluorescent beads. The lateral and axial maximum intensity projections (MIPs) of beads are shown, after performing the Richardson–Lucy (RL) deconvolution. The resolved FWHM is 6.06 μm in the x direction and 35.40 μm in the z direction. A zoom-in image of the green box in the zy MIP image is also shown here, which indicates two beads with 10.35  μm depth distance, exhibiting the 3D imaging capability.
    Dictionary learning procedure of LFME.
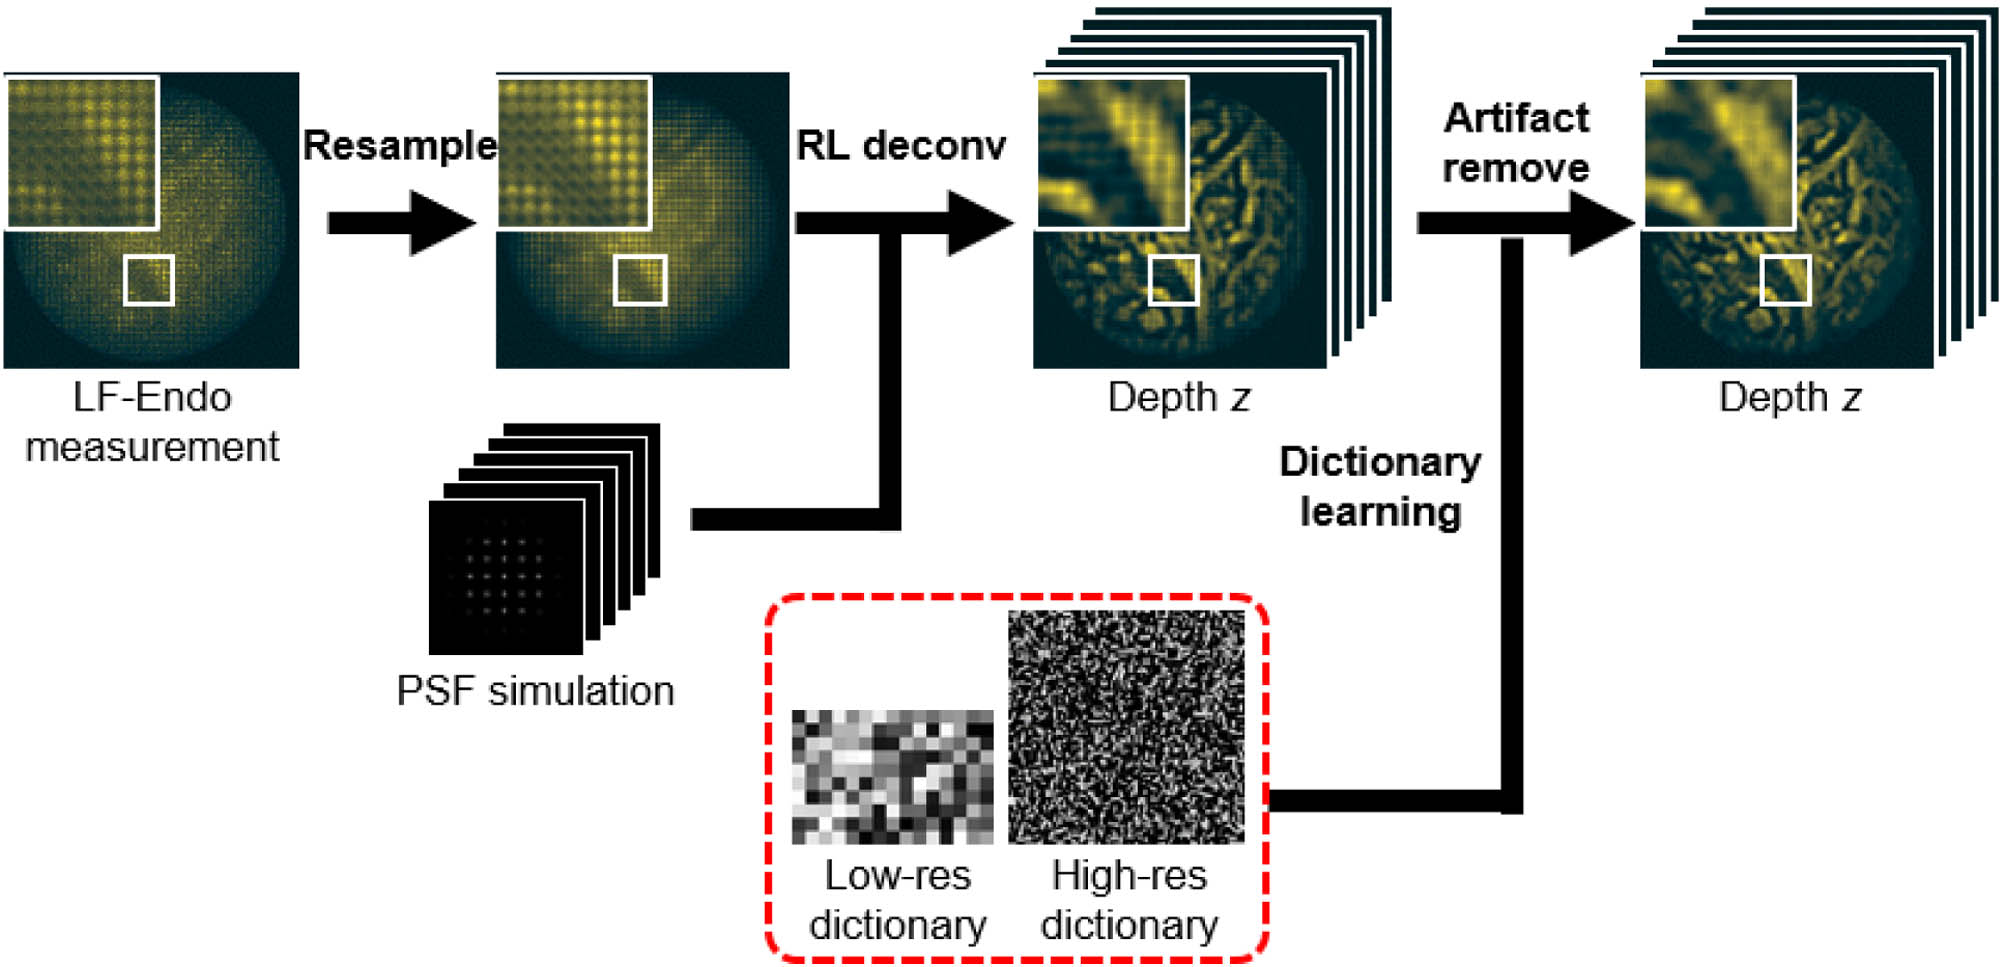
    Fig. 2. Dictionary learning procedure of LFME.
    Fluorescence imaging with LFME. (a) Raw fluorescence light-field image of the human skin tissue. (b) Raw fluorescence image captured without MLA as a reference. Both images have heavy pixelation and large background fluorescence. Reconstructed fluorescence imaging in a certain slice using (c) RL deconvolution (Decov) and (d) dictionary learning after deconvolution (Decov+Dict), respectively. Benefiting from the optical design and reconstruction process of LFME, our method can resolve detailed structures of the skin tissue from (a) with a clean background. As shown in the enlarged drawings marked by the yellow box and the intensity curve in (f), dictionary learning can suppress artifacts and increase the contrast of reconstruction. (e1) is the central view image of a USAF-1951 resolution chart, while (e2) and (e3) are the reconstruction results using RL deconvolution and dictionary learning after deconvolution, respectively. Intensity curves shown in (g) correspond to the red, orange, and blue lines in (e1), (e2), and (e3), respectively.
    Fig. 3. Fluorescence imaging with LFME. (a) Raw fluorescence light-field image of the human skin tissue. (b) Raw fluorescence image captured without MLA as a reference. Both images have heavy pixelation and large background fluorescence. Reconstructed fluorescence imaging in a certain slice using (c) RL deconvolution (Decov) and (d) dictionary learning after deconvolution (Decov+Dict), respectively. Benefiting from the optical design and reconstruction process of LFME, our method can resolve detailed structures of the skin tissue from (a) with a clean background. As shown in the enlarged drawings marked by the yellow box and the intensity curve in (f), dictionary learning can suppress artifacts and increase the contrast of reconstruction. (e1) is the central view image of a USAF-1951 resolution chart, while (e2) and (e3) are the reconstruction results using RL deconvolution and dictionary learning after deconvolution, respectively. Intensity curves shown in (g) correspond to the red, orange, and blue lines in (e1), (e2), and (e3), respectively.
    Lateral resolution analysis for LFME. (a) Simulated LFME measurements of a point source in different axial positions. (b) Deconvolved images of a point source in different axial positions. (c) Experimentally characterized lateral resolution by imaging the resolution chart. (d) The simulated modulation transfer function (MTF) varies across different depths.
    Fig. 4. Lateral resolution analysis for LFME. (a) Simulated LFME measurements of a point source in different axial positions. (b) Deconvolved images of a point source in different axial positions. (c) Experimentally characterized lateral resolution by imaging the resolution chart. (d) The simulated modulation transfer function (MTF) varies across different depths.
    Fluorescence imaging by directly applying SMFB. From (a1)–(a8), the resolution chart is successively placed 0–25 μm away from the distal end of SMFB. (b1)–(b8) show corresponding enlarged drawings.
    Fig. 5. Fluorescence imaging by directly applying SMFB. From (a1)–(a8), the resolution chart is successively placed 0–25 μm away from the distal end of SMFB. (b1)–(b8) show corresponding enlarged drawings.
    3D imaging of biological samples with LFME. (a1) Recovered lateral (x−y) MIP image of HeLa cells using RL deconvolution (Decov). The x−z and y−z slices of the sample (marked by white dashed lines in the x−y MIP image) are exhibited simultaneously. (a2) Results of HeLa cells using dictionary learning method (Decov+Dict). (b1) and (b2) show results of a human skin tissue section in area 1 by using these two methods respectively, while (c1) and (c2) show results of the skin tissue in area 2.
    Fig. 6. 3D imaging of biological samples with LFME. (a1) Recovered lateral (xy) MIP image of HeLa cells using RL deconvolution (Decov). The xz and yz slices of the sample (marked by white dashed lines in the xy MIP image) are exhibited simultaneously. (a2) Results of HeLa cells using dictionary learning method (Decov+Dict). (b1) and (b2) show results of a human skin tissue section in area 1 by using these two methods respectively, while (c1) and (c2) show results of the skin tissue in area 2.
    Effectiveness of rotating diffuser in LFME. We show experimentally captured images of the fluorescent plate, HeLa cells, and skin tissue to demonstrate the effectiveness of rotating diffuser in LFME. The former three columns directly use the lens pair for acquisition without using the MLA. The first column indicates imaging without the diffuser, which has undesirable interference patterns (labeled by yellow arrows) and speckles. The second column indicates imaging by applying a diffuser, where the interference pattern is suppressed, but the speckles still exist. The third column indicates imaging by rotating the diffuser continuously to weaken the spatial coherence of the laser source, where the speckles are eliminated at this time. The last column uses both the lens pair and MLA with diffuser rotation for image acquisition, which indicates the input raw light-field measurement. (b5) and (c5) are the reconstructed images with high resolution and clean backgrounds from the raw light-field measurements.
    Fig. 7. Effectiveness of rotating diffuser in LFME. We show experimentally captured images of the fluorescent plate, HeLa cells, and skin tissue to demonstrate the effectiveness of rotating diffuser in LFME. The former three columns directly use the lens pair for acquisition without using the MLA. The first column indicates imaging without the diffuser, which has undesirable interference patterns (labeled by yellow arrows) and speckles. The second column indicates imaging by applying a diffuser, where the interference pattern is suppressed, but the speckles still exist. The third column indicates imaging by rotating the diffuser continuously to weaken the spatial coherence of the laser source, where the speckles are eliminated at this time. The last column uses both the lens pair and MLA with diffuser rotation for image acquisition, which indicates the input raw light-field measurement. (b5) and (c5) are the reconstructed images with high resolution and clean backgrounds from the raw light-field measurements.
    Comparison of light-field measurements before (left) and after (right) the resample step.
    Fig. 8. Comparison of light-field measurements before (left) and after (right) the resample step.
    Comparison of light-field deconvolution with and without rotating the diffuser.
    Fig. 9. Comparison of light-field deconvolution with and without rotating the diffuser.
    Comparison of system’s PSFs before and after the fiber bundle by imaging fluorescent beads.
    Fig. 10. Comparison of system’s PSFs before and after the fiber bundle by imaging fluorescent beads.
    Lateral resolution testing in a larger DoF.
    Fig. 11. Lateral resolution testing in a larger DoF.
    You Zhou, Bo Xiong, Weizhi Song, Xu Zhang, Guoan Zheng, Qionghai Dai, Xun Cao. Light-field micro-endoscopy using a fiber bundle: a snapshot 3D epi-fluorescence endoscope[J]. Photonics Research, 2022, 10(9): 2247
    Download Citation