
Shidong Lu, Meiyi Tu, Xiaoyong Luo, Chao Guo. Laser SLAM Pose Optimization Algorithm Based on Graph Optimization Theory and GNSS[J]. Laser & Optoelectronics Progress, 2020, 57(8): 081024
- Laser & Optoelectronics Progress
- Vol. 57, Issue 8, 081024 (2020)
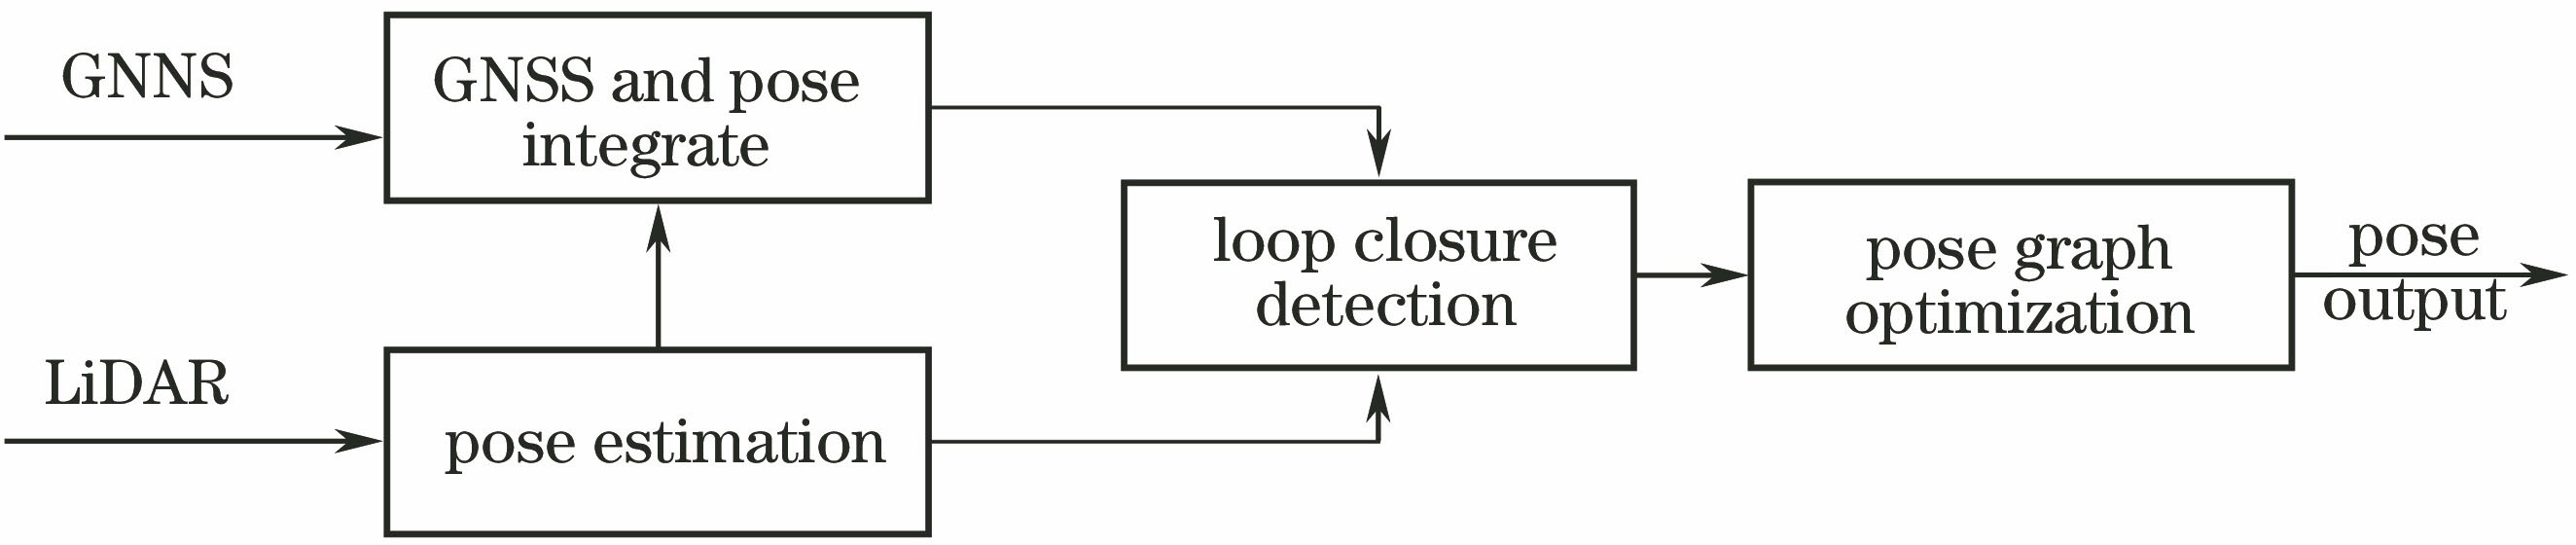
Fig. 1. Algorithm framework diagram
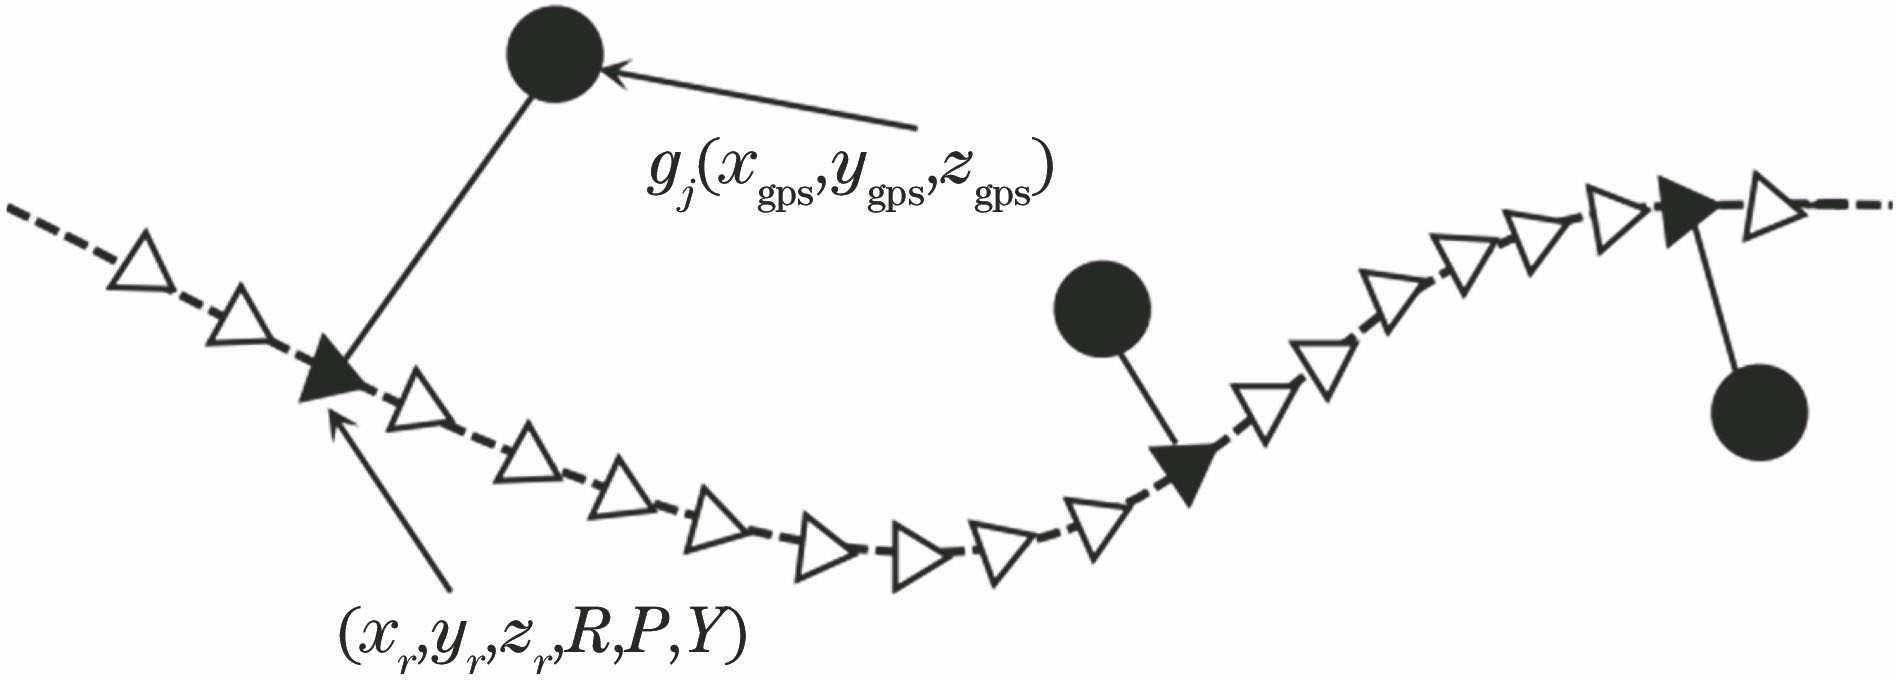
Fig. 2. Pose graph integrated with GNSS position data
Fig. 3. Accuracy of point cloud registration pose estimation
Fig. 4. GNSS-SLAM pose correction when there is no loopback
Fig. 5. Diagram of loop closure optimization
Fig. 6. Loop closure detection diagram
Fig. 7. Hardware picture of experiment
Fig. 8. Test without loopback in urban environment. (a) With GNSS pose optimization; (b) without GNSS pose optimization
Fig. 9. Loop trajectory test in urban environment. (a) With GNSS pose optimization; (b) without GNSS pose optimization
Fig. 10. Test without loopback in non-urban environment. (a) With GNSS pose optimization; (b) without GNSS pose optimization
Fig. 11. Picture of non-urban environment
Fig. 12. Loop trajectory test in non-urban environment. (a) With GNSS pose optimization; (b) without GNSS pose optimization
| ||||||||||||||||||||
Table 1. Experimental software and hardware related instructions and parameters
| ||||||||||||||||||||||||||||||||||||||||||||||||||||||||||||||||||||
Table 2. Trajectory drift comparisonm

Set citation alerts for the article
Please enter your email address
© Copyright 2018-2021 | Chinese Laser Press. All Rights Reserved 沪ICP备15018463号-20